Please solve
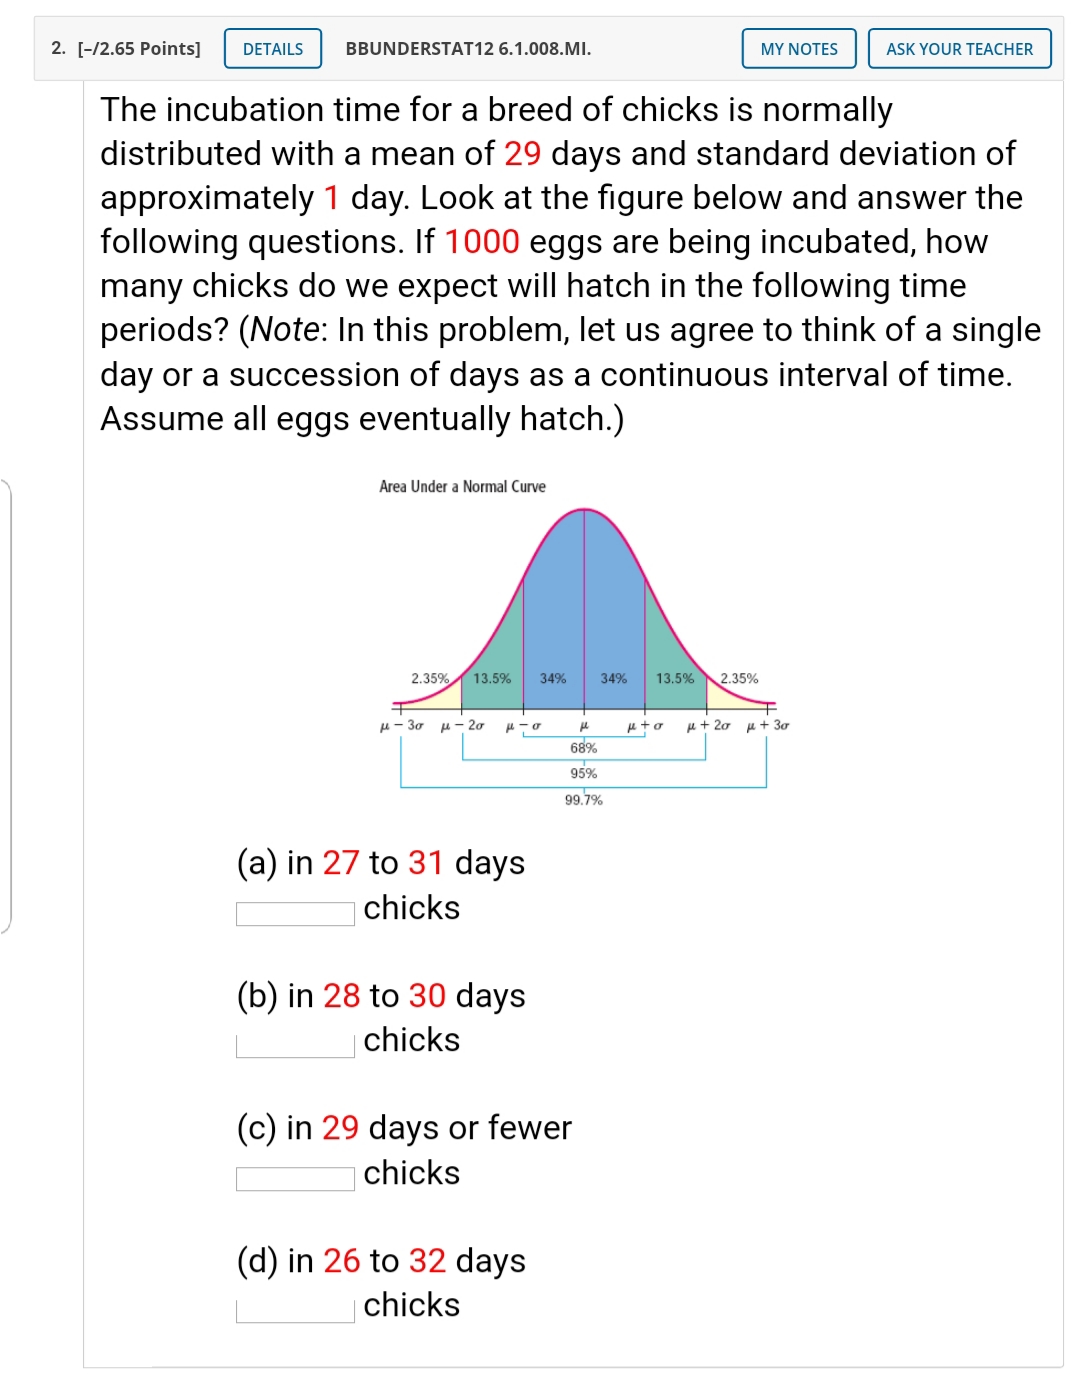
8. [-/2.65 Points] DETAILS BBUNDERSTAT12 6.3.005.MI. MY NOTES ASK YOUR TEACHER Assume that x has a normal distribution with the specified mean and standard deviation. Find the indicated probability. (Round your answer to four decimal places.) U = 4;0 =2 P(3 s x 5 7) = 9. [-/2.65 Points] DETAILS BBUNDERSTAT12 6.3.007. MY NOTES ASK YOUR TEACHER Assume that x has a normal distribution with the specified mean and standard deviation. Find the indicated probability. (Round your answer to four decimal places.) U = 41; 0 = 16 P(50 s X s 70) = 10. [-/2.65 Points] DETAILS BBUNDERSTAT12 6.3.011.MI. MY NOTES ASK YOUR TEACHER Assume that x has a normal distribution with the specified mean and standard deviation. Find the indicated probability. (Round your answer to four decimal places.) In USE SALT U = 26; 0 = 4.4 P(X 2 30) =4. [-/2.65 Points] DETAILS BBUNDERSTAT12 6.2.005.MI. MY NOTES ASK YOUR TEACHER A normal distribution has / = 24 and O = 5. (a) Find the z score corresponding to x= 19. (b) Find the z score corresponding to x= 38. (c) Find the raw score corresponding to z= -3. (d) Find the raw score corresponding to z= 1.1. 5. [-/2.65 Points] DETAILS BBUNDERSTAT12 6.2.015.MI. MY NOTES ASK YOUR TEACHER Sketch the area under the standard normal curve over the indicated interval and find the specified area. (Round your answer to four decimal places.) The area to the left of z=-1.32 is 6. [-/2.65 Points] DETAILS BBUNDERSTAT12 6.2.019.MI. MY NOTES ASK YOUR TEACHER Sketch the area under the standard normal curve over the indicated interval and find the specified area. (Round your answer to four decimal places.) The area to the right of z = 1.53 is 7. [-/2.65 Points] DETAILS BBUNDERSTAT12 6.2.025.MI. MY NOTES ASK YOUR TEACHER Sketch the area under the standard normal curve over the indicated interval and find the specified area. (Round your answer to four decimal places.) The area between z=-2.28 and z = 1.42 isAt Burnt Mesa Pueblo, archaeological studies have used the method of tree-ring dating in an effort to determine when prehistoric people lived in the pueblo. Wood from several excavations gave a mean of (year) 1238 with a standard deviation of 25 years. The distribution of dates was more or less mound-shaped and symmetric about the mean. Use the empirical rule to estimate the following. (a) a range of years centered about the mean in which about 68% of the data (tree-ring dates) will be found between and A. D. (b) a range of years centered about the mean in which about 95% of the data (tree-ring dates) will be found between and A. D. (c) a range of years centered about the mean in which almost all the data (tree-ring dates) will be found between and A. D. 2. [12.65 Points] BBUNDERSTAT126.1.008.MI. The incubation time for a breed of chicks is normally distributed with a mean of 29 days and standard deviation of approximately 1 day. Look at the gure below and answer the following questions. If 1000 eggs are being incubated, how many chicks do we expect will hatch in the following time periods? (Note: In this problem, let us agree to think of a single day or a succession of days as a continuous interval of time. Assume all eggs eventually hatch.) Area Under a Nomi Clive (a) in 27 to 31 days chicks (b) in 28 to 30 days chicks (c) in 29 days or fewer chicks (d) in 26 to 32 days chicks 1. [12.65 Points] BBUNDERSTAT126.1.007. Assuming that the heights of college women are normally distributed with mean 60 inches and standard deviation 2.1 inches, answer the following questions. (Hint: Use the gure below with mean y and standard deviation 0.) ea Under a Manual Cave 2 .3593 2.35% 1130 5120 lpic pi. n+9- p+2r p+3a |gm 959$. 99.5% (a) What percentage of women are taller than 60 inches? :90 (b) What percentage of women are shorter than 60 inches? 96 (c) What percentage of women are between 57.9 inches and 62.1 inches? % (d) What percentage of women are between 55.8 and 64.2 inches? % (a) If specications for a research project require the standard error of the corresponding x distribution to be 7, how large does the sample size need to be? Recall that the standard deviation (also known as the standard error) of the distribution is o=% where U is the standard deviation of the x distribution. Find the sample size n for the research project given that G=Tand 0:70. (b) in 30 to 32 days Now we wish to determine how many of the 10,000 eggs can be expected to hatch in 30 to 32 days. Since 30 is one standard deviation to the left of [J = 31 and 32 is one standard deviation to the right of u = 31, we need to nd the area under the normal curve from y-o' to (4+0. Am Under a Normal (me 2 .3596 2.35% {1-30 9-20 {11: It n+0- psi-20 \"+30 I | a195, i 99.?98 Referring to the gure above, we see that it; of the area under the curve falls between these values. Therefore. '35 of the 10.000 chicks can be expected to hatch in 30 to 32 days. In other words, we expect eggs to hatch during this time period. , Now find n+0. Recall that 0' represents the standard deviation. For a normal curve, as we have here, a point three standard deviations to the right of center will be located at the point where the curve is nearly touching the horizontal axis. lkk 66 69 72 ?5 Observing the graph of the normal curve we see that the point three standard deviations to the right of center is located at X = 75. Therefore, it = 72 is two standard deviations to the right of center and X = is one standard deviation to the right of center. We previously determined that y = . So, [.1 + 0' = Tutorial Exercise Look at the normal curve below, and find u, u + o, and o. 99 69 72 75 Step 1 First find M. Recall that a normal curve is bell-shaped with the highest point over the mean, Ju. 66 69 72 75 Observing the given normal curve we see that the highest point is located when x = 66 66 . Therefore, M = 66 4 66 . Step 2 Now find + o. Recall that o represents the standard deviation. For a normal curve, as we have here, a point three standard deviations to the right of center will be located at the point where the curve is nearly touching the horizontal axis. 66 69 72 75 Observing the graph of the normal curve we see that the point three standard deviations to the right of center is located at x = 75. Therefore, x = 72 is two standard deviations to the right of center and x = is one standard deviation to the right of center. We previously determined that / = So, H + 0 =