

Answered step by step
Verified Expert Solution
Question
1 Approved Answer
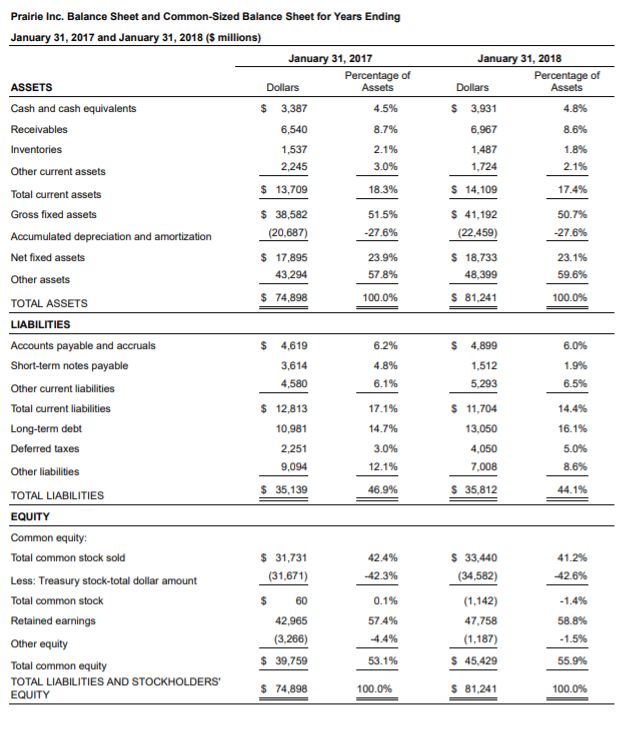
Please solve all questions. Mini Case. Chapter 3 (similar to) Question Help The financial statements for 2017 and 2018 for Crosby Co. are shown in
Please solve all questions.
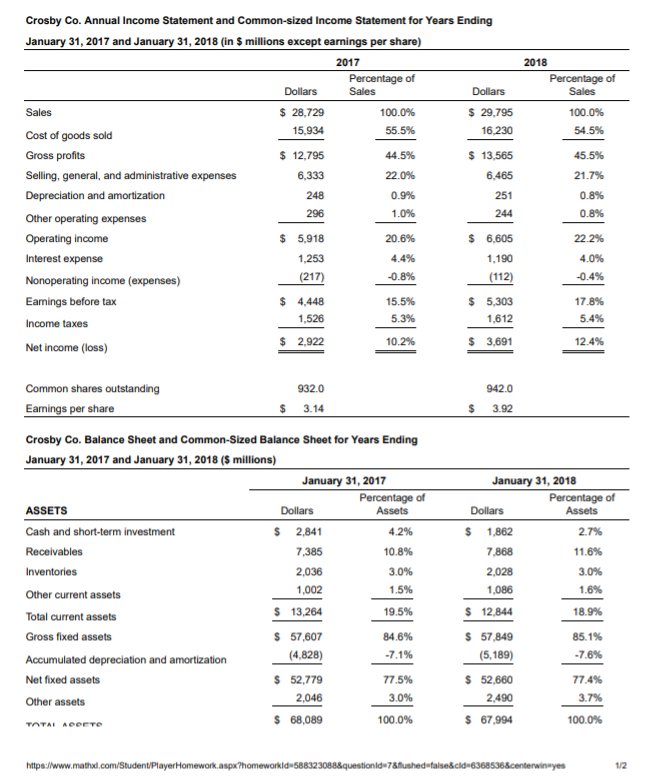
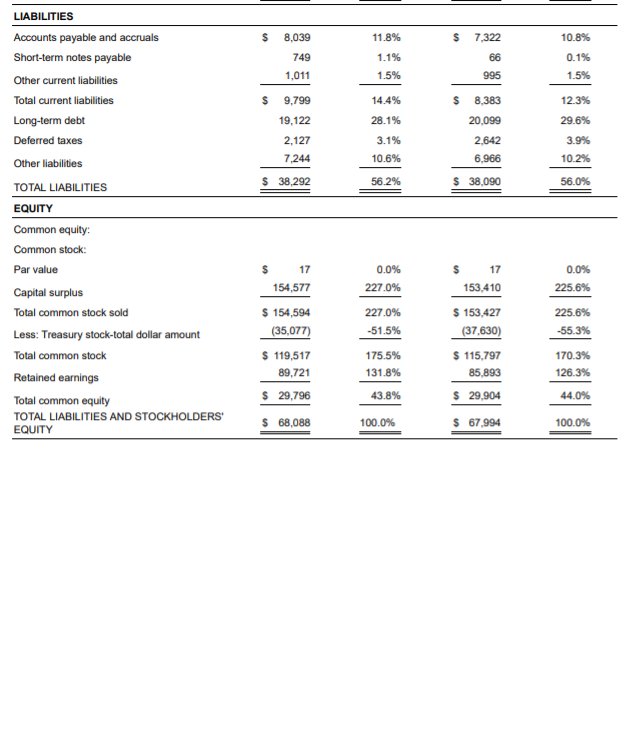
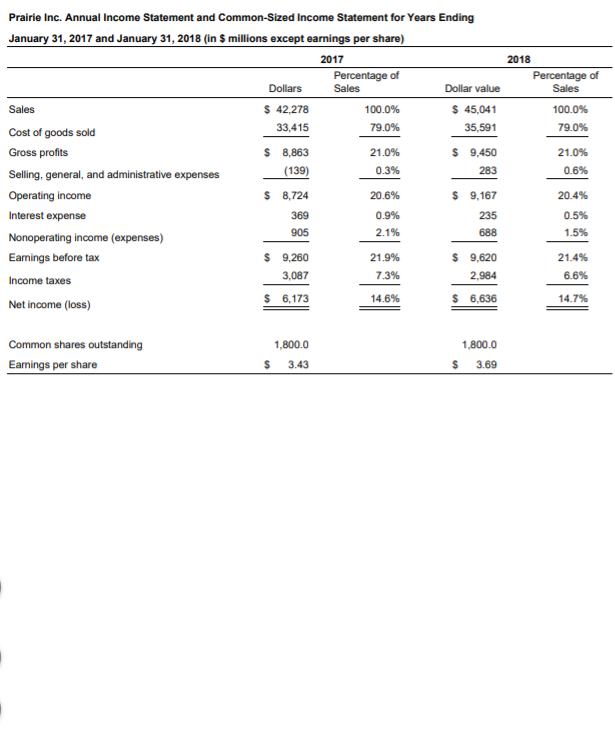
Mini Case. Chapter 3 (similar to) Question Help The financial statements for 2017 and 2018 for Crosby Co. are shown in this popup window, E, and those for Prairie Inc. are shown in this popup window, a. How did Crosby Co.'s profit margins change from 2017 to 2018? To what would you attribute the differences? Answer the same question for Prairie Inc. b. Compare the profit margins between Crosby Co. and Prairie Inc. How are they different? How would you explain these differences? c. What differences do you notice in the common-sized balance sheets that might indicate that one of the firms is doing better than the other? a. How did Crosby Co.'s gross profit margin change from 2017 to 2018? 1% (Round to one decimal place.) 2018 Percentage of Sales 100.0% 54.5% 45.5% 21.7% Crosby Co. Annual Income Statement and Common-sized Income Statement for Years Ending January 31, 2017 and January 31, 2018 (in $ millions except earnings per share) 2017 Percentage of Dollars Sales Dollars Sales $ 28,729 100.0% $ 29,795 Cost of goods sold 15,934 55.5% 16.230 Gross profits $ 12,795 44.5% $ 13,565 Selling, general, and administrative expenses 6,333 22.0% 6,465 Depreciation and amortization 0.9% 251 Other operating expenses 1.0% 244 Operating income $ 5,918 20.6% $ 6,605 Interest expense 1.253 4.4% 1,190 Nonoperating income (expenses) (217) -0.8% (112) Earnings before tax $ 4,448 15.5% $ 5,303 Income taxes 1,526 5.3% 1,612 Net income (loss) $ 2,922 10.2% $ 3,691 248 0.8% 0.8% 296 22.2% 4.0% -0.4% 17.8% 5.4% 12.4% 942.0 $ 3.92 Common shares outstanding 932.0 Earnings per share $ 3.14 Crosby Co. Balance Sheet and Common-Sized Balance Sheet for Years Ending January 31, 2017 and January 31, 2018 (5 millions) January 31, 2017 Percentage of ASSETS Dollars Assets Cash and short-term investment $ 2,841 4.2% Receivables 7,385 10.8% Inventories 2,036 3.0% Other current assets 1,002 1.5% Total current assets $ 13,264 19.5% Gross fixed assets $ 57,607 Accumulated depreciation and amortization (4,828) -7.1% Net fixed assets $ 52,779 77.5% Other assets 2,046 3.0% TATAI ACCETO $ 68,089 100.0% January 31, 2018 Percentage of Dollars Assets $ 1,862 2.7% 7,868 11.6% 2,028 3.0% 1,086 1.6% $ 12,844 18.9% $ 57,849 (5,189) -7.6% $ 52,660 77.4% 2.490 3.7% $ 67,994 100.0% 84.6% 85.1% littps://www.mathal.com/StudentiPlayerHomework.aspx?homeworkId=688323088&question 63685368.centerwinnyes 12 $ 8,039 11.8% $ 7,322 10.8% 749 1.1% 0.1% 66 995 1,011 1.5% 1.5% 12.3% 29.6% $ 9,799 19,122 2,127 7,244 14.4% 28.1% 3.1% 10.6% $ 8,383 20,099 2.642 6.966 3.9% 10.2% $ 38,292 56.2% $ 38,090 56.0% LIABILITIES Accounts payable and accruals Short-term notes payable Other current liabilities Total current liabilities Long-term debt Deferred taxes Other liabilities TOTAL LIABILITIES EQUITY Common equity: Common stock: Par value Capital surplus Total common stock sold Less: Treasury stock-total dollar amount Total common stock Retained earnings Total common equity TOTAL LIABILITIES AND STOCKHOLDERS EQUITY 0.0% 225.6% $ 17 154,577 $ 154,594 (35,077) $ 119,517 89,721 $ 29,796 0.0% 227.0% 227.0% -51.5% 175.5% 131.8% 43.8% 100.0% $ 17 153,410 $ 153,427 (37,630) $ 115,797 85,893 $ 29,904 225.6% -55.3% 170.3% 126.3% 44.0% $ 68,088 $67,994 100.0% Prairie Inc. Annual Income Statement and Common-Sized Income Statement for Years Ending January 31, 2017 and January 31, 2018 (in $ millions except earnings per share) 2017 2018 Percentage of Percentage of Dollars Sales Dollar value Sales Sales $ 42,278 100.0% $ 45,041 100.0% Cost of goods sold 33,415 79.0% 35,591 79.0% Gross profits $ 8,863 21.0% $ 9,450 21.0% (139) Selling, general, and administrative expenses 283 0.3% 0.6% Operating income $ 8,724 20.6% $ 9.167 20.4% Interest expense 369 0.9% 235 0.5% 905 2.1% 688 1.5% Nonoperating income (expenses) Earnings before tax $ 9,260 21.9% $ 9,620 21.4% Income taxes 3,087 7.3% 2,984 6.6% $ 6,173 Net income (loss) 14.6% $ 6,636 14.7% Common shares outstanding Earnings per share 1,800.0 $ 3.43 1.800.0 $ 3.69 January 31, 2018 Percentage of Dollars Assets $ 3,931 4.8% 6,967 8.6% 1,487 1.8% 1,724 2.1% $ 14,109 17.4% 50.7% $ 41,192 (22,459) -27.6% $ 18,733 48,399 $ 81,241 23.1% 59.6% 100.0% Prairie Inc. Balance Sheet and Common-Sized Balance Sheet for Years Ending January 31, 2017 and January 31, 2018 (5 millions) January 31, 2017 Percentage of ASSETS Dollars Assets Cash and cash equivalents $ 3,387 4.5% Receivables 6,540 8.7% Inventories 1,537 2.1% 2,245 3.0% Other current assets Total current assets $ 13,709 18.3% Gross fixed assets $ 38,582 51.5% Accumulated depreciation and amortization (20,687) -27.6% Net fixed assets $ 17,895 23.9% Other assets 43.294 57.8% TOTAL ASSETS $ 74,898 100.0% LIABILITIES Accounts payable and accruals $ 4,619 6.2% Short-term notes payable 3,614 4.8% Other current liabilities 4,580 6.1% Total current liabilities $ 12,813 17.1% Long-term debt 10,981 14.7% Deferred taxes 2.251 3.0% 9,094 12.1% Other liabilities $ $ 35,139 46.9% TOTAL LIABILITIES EQUITY Common equity Total common stock sold $ 31,731 42.4% Less: Treasury stock-total dollar amount (31,671) -42.3% Total common stock 60 0.1% Retained earnings 42,965 57.4% Other equity (3.266) -4.4% Total common equity $ 39,759 53.1% TOTAL LIABILITIES AND STOCKHOLDERS' 100.0% $ 74,898 EQUITY 4,899 1,512 5,293 6.0% 1.9% 6.5% 14.4% $ 11,704 13,050 4,050 7.008 16.1% 5.0% 8.6% $ 35,812 44.1% 41.2% 42.6% -1.4% $ 33,440 (34,582) (1,142) 47,758 (1,187) $ 45,429 58.8% -1.5% 55.9% $ 81,241 100.0% Mini Case. Chapter 3 (similar to) Question Help The financial statements for 2017 and 2018 for Crosby Co. are shown in this popup window, E, and those for Prairie Inc. are shown in this popup window, a. How did Crosby Co.'s profit margins change from 2017 to 2018? To what would you attribute the differences? Answer the same question for Prairie Inc. b. Compare the profit margins between Crosby Co. and Prairie Inc. How are they different? How would you explain these differences? c. What differences do you notice in the common-sized balance sheets that might indicate that one of the firms is doing better than the other? a. How did Crosby Co.'s gross profit margin change from 2017 to 2018? 1% (Round to one decimal place.) 2018 Percentage of Sales 100.0% 54.5% 45.5% 21.7% Crosby Co. Annual Income Statement and Common-sized Income Statement for Years Ending January 31, 2017 and January 31, 2018 (in $ millions except earnings per share) 2017 Percentage of Dollars Sales Dollars Sales $ 28,729 100.0% $ 29,795 Cost of goods sold 15,934 55.5% 16.230 Gross profits $ 12,795 44.5% $ 13,565 Selling, general, and administrative expenses 6,333 22.0% 6,465 Depreciation and amortization 0.9% 251 Other operating expenses 1.0% 244 Operating income $ 5,918 20.6% $ 6,605 Interest expense 1.253 4.4% 1,190 Nonoperating income (expenses) (217) -0.8% (112) Earnings before tax $ 4,448 15.5% $ 5,303 Income taxes 1,526 5.3% 1,612 Net income (loss) $ 2,922 10.2% $ 3,691 248 0.8% 0.8% 296 22.2% 4.0% -0.4% 17.8% 5.4% 12.4% 942.0 $ 3.92 Common shares outstanding 932.0 Earnings per share $ 3.14 Crosby Co. Balance Sheet and Common-Sized Balance Sheet for Years Ending January 31, 2017 and January 31, 2018 (5 millions) January 31, 2017 Percentage of ASSETS Dollars Assets Cash and short-term investment $ 2,841 4.2% Receivables 7,385 10.8% Inventories 2,036 3.0% Other current assets 1,002 1.5% Total current assets $ 13,264 19.5% Gross fixed assets $ 57,607 Accumulated depreciation and amortization (4,828) -7.1% Net fixed assets $ 52,779 77.5% Other assets 2,046 3.0% TATAI ACCETO $ 68,089 100.0% January 31, 2018 Percentage of Dollars Assets $ 1,862 2.7% 7,868 11.6% 2,028 3.0% 1,086 1.6% $ 12,844 18.9% $ 57,849 (5,189) -7.6% $ 52,660 77.4% 2.490 3.7% $ 67,994 100.0% 84.6% 85.1% littps://www.mathal.com/StudentiPlayerHomework.aspx?homeworkId=688323088&question 63685368.centerwinnyes 12 $ 8,039 11.8% $ 7,322 10.8% 749 1.1% 0.1% 66 995 1,011 1.5% 1.5% 12.3% 29.6% $ 9,799 19,122 2,127 7,244 14.4% 28.1% 3.1% 10.6% $ 8,383 20,099 2.642 6.966 3.9% 10.2% $ 38,292 56.2% $ 38,090 56.0% LIABILITIES Accounts payable and accruals Short-term notes payable Other current liabilities Total current liabilities Long-term debt Deferred taxes Other liabilities TOTAL LIABILITIES EQUITY Common equity: Common stock: Par value Capital surplus Total common stock sold Less: Treasury stock-total dollar amount Total common stock Retained earnings Total common equity TOTAL LIABILITIES AND STOCKHOLDERS EQUITY 0.0% 225.6% $ 17 154,577 $ 154,594 (35,077) $ 119,517 89,721 $ 29,796 0.0% 227.0% 227.0% -51.5% 175.5% 131.8% 43.8% 100.0% $ 17 153,410 $ 153,427 (37,630) $ 115,797 85,893 $ 29,904 225.6% -55.3% 170.3% 126.3% 44.0% $ 68,088 $67,994 100.0% Prairie Inc. Annual Income Statement and Common-Sized Income Statement for Years Ending January 31, 2017 and January 31, 2018 (in $ millions except earnings per share) 2017 2018 Percentage of Percentage of Dollars Sales Dollar value Sales Sales $ 42,278 100.0% $ 45,041 100.0% Cost of goods sold 33,415 79.0% 35,591 79.0% Gross profits $ 8,863 21.0% $ 9,450 21.0% (139) Selling, general, and administrative expenses 283 0.3% 0.6% Operating income $ 8,724 20.6% $ 9.167 20.4% Interest expense 369 0.9% 235 0.5% 905 2.1% 688 1.5% Nonoperating income (expenses) Earnings before tax $ 9,260 21.9% $ 9,620 21.4% Income taxes 3,087 7.3% 2,984 6.6% $ 6,173 Net income (loss) 14.6% $ 6,636 14.7% Common shares outstanding Earnings per share 1,800.0 $ 3.43 1.800.0 $ 3.69 January 31, 2018 Percentage of Dollars Assets $ 3,931 4.8% 6,967 8.6% 1,487 1.8% 1,724 2.1% $ 14,109 17.4% 50.7% $ 41,192 (22,459) -27.6% $ 18,733 48,399 $ 81,241 23.1% 59.6% 100.0% Prairie Inc. Balance Sheet and Common-Sized Balance Sheet for Years Ending January 31, 2017 and January 31, 2018 (5 millions) January 31, 2017 Percentage of ASSETS Dollars Assets Cash and cash equivalents $ 3,387 4.5% Receivables 6,540 8.7% Inventories 1,537 2.1% 2,245 3.0% Other current assets Total current assets $ 13,709 18.3% Gross fixed assets $ 38,582 51.5% Accumulated depreciation and amortization (20,687) -27.6% Net fixed assets $ 17,895 23.9% Other assets 43.294 57.8% TOTAL ASSETS $ 74,898 100.0% LIABILITIES Accounts payable and accruals $ 4,619 6.2% Short-term notes payable 3,614 4.8% Other current liabilities 4,580 6.1% Total current liabilities $ 12,813 17.1% Long-term debt 10,981 14.7% Deferred taxes 2.251 3.0% 9,094 12.1% Other liabilities $ $ 35,139 46.9% TOTAL LIABILITIES EQUITY Common equity Total common stock sold $ 31,731 42.4% Less: Treasury stock-total dollar amount (31,671) -42.3% Total common stock 60 0.1% Retained earnings 42,965 57.4% Other equity (3.266) -4.4% Total common equity $ 39,759 53.1% TOTAL LIABILITIES AND STOCKHOLDERS' 100.0% $ 74,898 EQUITY 4,899 1,512 5,293 6.0% 1.9% 6.5% 14.4% $ 11,704 13,050 4,050 7.008 16.1% 5.0% 8.6% $ 35,812 44.1% 41.2% 42.6% -1.4% $ 33,440 (34,582) (1,142) 47,758 (1,187) $ 45,429 58.8% -1.5% 55.9% $ 81,241 100.0%Step by Step Solution
There are 3 Steps involved in it
Step: 1

Get Instant Access to Expert-Tailored Solutions
See step-by-step solutions with expert insights and AI powered tools for academic success
Step: 2

Step: 3
Ace Your Homework with AI
Get the answers you need in no time with our AI-driven, step-by-step assistance
Get Started
Stock Market Investing For Beginners
Authors: Andrew P.C.
1st Edition
1549522132, 978-1549522130