please solve and send excel formula
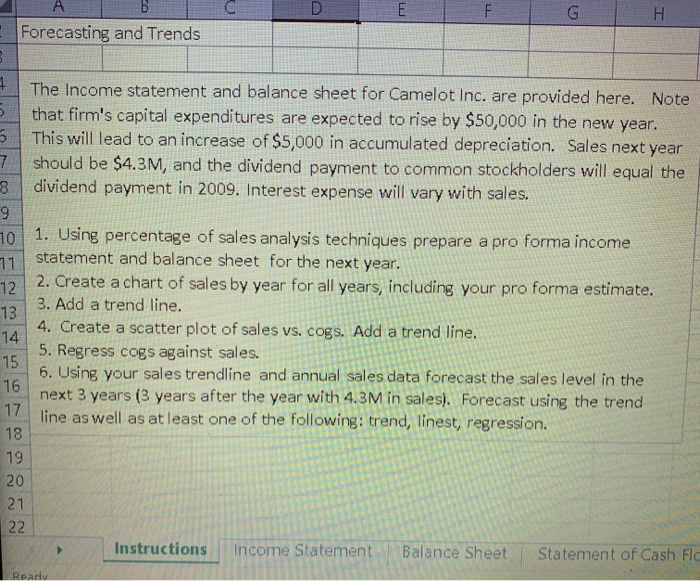
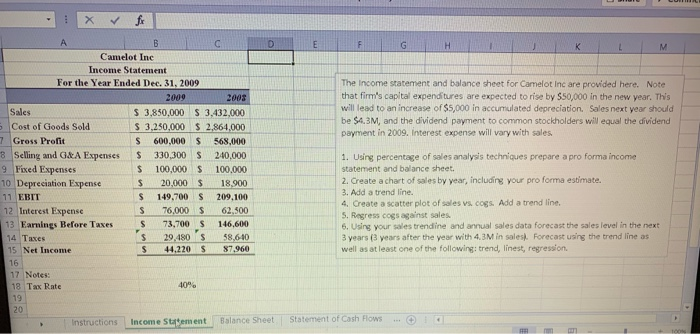
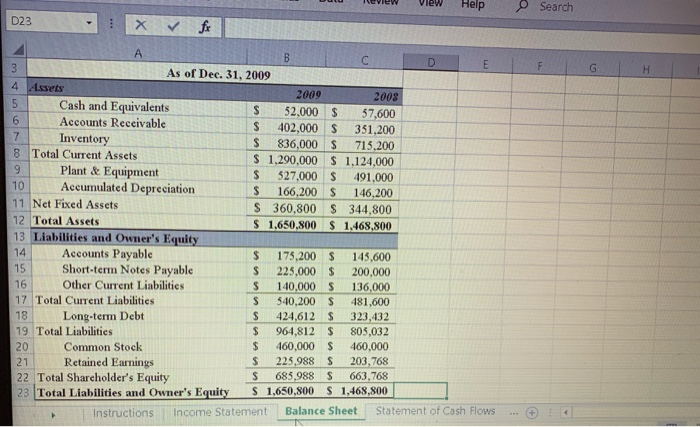
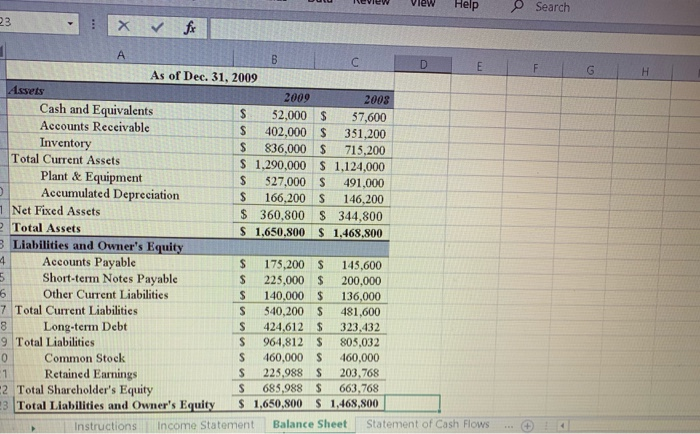
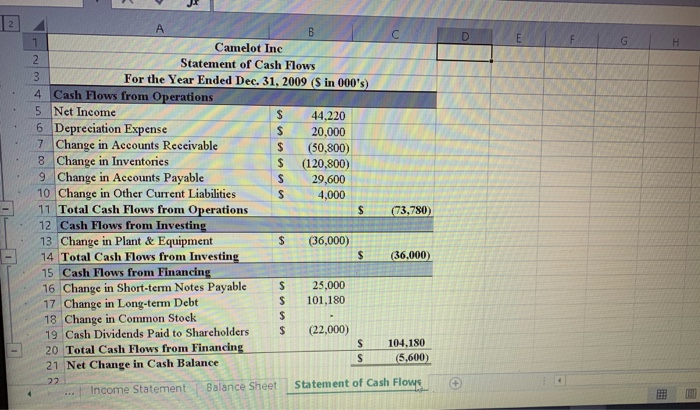
ABC Forecasting and Trends The Income statement and balance sheet for Camelot Inc. are provided here. Note that firm's capital expenditures are expected to rise by $50,000 in the new year. This will lead to an increase of $5,000 in accumulated depreciation. Sales next year should be $4.3M, and the dividend payment to common stockholders will equal the dividend payment in 2009. Interest expense will vary with sales. B 10 1. Using percentage of sales analysis techniques prepare a pro forma income statement and balance sheet for the next year. 2. Create a chart of sales by year for all years, including your pro forma estimate. 3. Add a trend line. 4. Create a scatter plot of sales vs. cogs. Add a trend line. 5. Regress cogs against sales. 6. Using your sales trendline and annual sales data forecast the sales level in the next 3 years (3 years after the year with 4.3M in sales). Forecast using the trend line as well as at least one of the following: trend, linest, regression. Instructions Income Statement Balance Sheet Statement of Cash Fle F G H I J K L M The income statement and balance sheet for Camelot Inc are provided here. Note that firm's capital expenditures are expected to rise by $50,000 in the new year. This will lead to an increase of $5,000 in accumulated depreciation Sales next year should be $4.3M, and the dividend payment to common stockholders will equal the dividend payment in 2009. Interest expense will vary with sales Camelot Inc Income Statement For the Year Ended Dec 31, 2009 2009 2008 Sales $ 3.850,000 S 3,432,000 Cost of Goods Sold S 3,250,000 $ 2,864,000 7 Gross Profit 600,000 $ 568,000 8 Selling and G&A Expenses $ 330,300 S 240,000 9 Fixed Expenses $ 100,000 $ 100,000 10 Depreciation Expense $ 20.000 $ 18.900 11 EBIT $ 149,700 S 209,100 12 Interest Expense 76,000S 62.500 13 Earnings Before Taxes 73,700 $ 146,600 14 Taxes 29.480 S 58,6-40 15 Net Income $ 44,220 $ 7,960 1. Using percentage of sales analysis techniques prepare a pro forma income statement and balance sheet. 2. Create a chart of sales by year, including your pro forma estimate 3. Add a trend line. 4. Create a scatter plot of sales vs. cogs. Add a trend line 5. Regresscogs against sales 6. Using your sales trendine and annual sales data forecast the sales level in the next 3 years 3 years after the year with 4. IM in sales Forecast using the trend line as well as at least one of the following trend, linest, regression 17 Notes 18 Tax Rate 19 Instructions Income Statement Balance Sheet Statement of Cash Flows Dulu Review View Help Search 1 X for As of Dec. 31, 2009 4 Assets 2009 2008 5 Cash and Equivalents $ 52,000 $ 57,600 6 Accounts Receivable S 402,000 $ 351,200 Inventory S 836,000 S 715,200 8 Total Current Assets $ 1.290,000 $ 1,124,000 9 Plant & Equipment S 527,000 $ 491,000 10 Accumulated Depreciation $ 166,200 $ 146,200 11 Net Fixed Assets S 360,800 $ 344,800 12 Total Assets $ 1,650,800 $ 1.468.800 13 Liabilities and Owner's Equity 14 Accounts Payable $ 175,200 $ 145,600 15 Short-term Notes Payable $ 225,000 $ 200,000 Other Current Liabilities $ 140,000 $ 136,000 17 Total Current Liabilities $ 540,200 $ 481,600 18 Long-term Debt $ 424,612 $ 323,432 19 Total Liabilities $ 964,812 $ 805,032 20 Common Stock $ 460,000 $ 460,000 Retained Earnings $ 225,988 S 203,768 22 Total Shareholder's Equity S 685,988 S 663,768 23 Total Liabilities and Owner's Equity S 1,650,800 $ 1,468,800 Instructions Income Statement Balance Sheet Statement of Cash Flows... 16 21 Review View HIP SECI F G H b c D E As of Dec. 31, 2009 Assets 2009 2008 Cash and Equivalents $ 52,000 $ 57,600 Accounts Receivable L S 402,000 $ 351,200 Inventory S 836,000 $ 715,200 Total Current Assets $ 1.290,000 $ 1,124,000 Plant & Equipment $ 527,000 $ 491,000 Accumulated Depreciation $ 166,200 $ 146,200 Net Fixed Assets $360,800 $ 344,800 Total Assets $1,650.800 $ 1.468.800 Liabilities and Owner's Equity Accounts Payable $ 175,200 $ 145,600 Short-term Notes Payable $ 225,000 $ 200,000 Other Current Liabilities S 140.000 $ 136,000 7 Total Current Liabilities S 540,200 $ 481,600 Long-term Debt S 424,612 S 323,432 9 Total Liabilities S 964,812 S 805,032 Common Stock $ 460,000 $ O 460,000 Retained Earnings $ 225,988 S 203,768 $ 685,988 $ 663,768 2 Total Shareholder's Equity Total Liabilities and Owner's Equity $1,650,800 $ 1,468,800 Income Statement Balance Sheet Statement of Cash Flows D CA B C Camelot Inc Statement of Cash Flows For the Year Ended Dec. 31, 2009 (S in 000's) 4 Cash Flows from Operations 5 Net Income S 44.220 6 Depreciation Expense $ 20,000 20,000 7 Change in Accounts Receivable $ (50.800) 8 Change in Inventories S (120.800) 9 Change in Accounts Payable S 29,600 10 Change in Other Current Liabilities 11 Total Cash Flows from Operations (73.780 12 Cash Flows from Investing 13 Change in Plant & Equipment 14 Total Cash Flows from Investing $ (36.000) 15 Cash Flows from Financing 16 Change in Short-term Notes Payable $ 25.000 17 Change in Long-term Debt $ 101,180 18 Change in Common Stock 19 Cash Dividends Paid to Shareholders (22,000) $ 104,180 20 Total Cash Flows from Financing (5,600) 21 Net Change in Cash Balance ... Income Statement Balance Sheet Statement of Cash Flows ABC Forecasting and Trends The Income statement and balance sheet for Camelot Inc. are provided here. Note that firm's capital expenditures are expected to rise by $50,000 in the new year. This will lead to an increase of $5,000 in accumulated depreciation. Sales next year should be $4.3M, and the dividend payment to common stockholders will equal the dividend payment in 2009. Interest expense will vary with sales. B 10 1. Using percentage of sales analysis techniques prepare a pro forma income statement and balance sheet for the next year. 2. Create a chart of sales by year for all years, including your pro forma estimate. 3. Add a trend line. 4. Create a scatter plot of sales vs. cogs. Add a trend line. 5. Regress cogs against sales. 6. Using your sales trendline and annual sales data forecast the sales level in the next 3 years (3 years after the year with 4.3M in sales). Forecast using the trend line as well as at least one of the following: trend, linest, regression. Instructions Income Statement Balance Sheet Statement of Cash Fle F G H I J K L M The income statement and balance sheet for Camelot Inc are provided here. Note that firm's capital expenditures are expected to rise by $50,000 in the new year. This will lead to an increase of $5,000 in accumulated depreciation Sales next year should be $4.3M, and the dividend payment to common stockholders will equal the dividend payment in 2009. Interest expense will vary with sales Camelot Inc Income Statement For the Year Ended Dec 31, 2009 2009 2008 Sales $ 3.850,000 S 3,432,000 Cost of Goods Sold S 3,250,000 $ 2,864,000 7 Gross Profit 600,000 $ 568,000 8 Selling and G&A Expenses $ 330,300 S 240,000 9 Fixed Expenses $ 100,000 $ 100,000 10 Depreciation Expense $ 20.000 $ 18.900 11 EBIT $ 149,700 S 209,100 12 Interest Expense 76,000S 62.500 13 Earnings Before Taxes 73,700 $ 146,600 14 Taxes 29.480 S 58,6-40 15 Net Income $ 44,220 $ 7,960 1. Using percentage of sales analysis techniques prepare a pro forma income statement and balance sheet. 2. Create a chart of sales by year, including your pro forma estimate 3. Add a trend line. 4. Create a scatter plot of sales vs. cogs. Add a trend line 5. Regresscogs against sales 6. Using your sales trendine and annual sales data forecast the sales level in the next 3 years 3 years after the year with 4. IM in sales Forecast using the trend line as well as at least one of the following trend, linest, regression 17 Notes 18 Tax Rate 19 Instructions Income Statement Balance Sheet Statement of Cash Flows Dulu Review View Help Search 1 X for As of Dec. 31, 2009 4 Assets 2009 2008 5 Cash and Equivalents $ 52,000 $ 57,600 6 Accounts Receivable S 402,000 $ 351,200 Inventory S 836,000 S 715,200 8 Total Current Assets $ 1.290,000 $ 1,124,000 9 Plant & Equipment S 527,000 $ 491,000 10 Accumulated Depreciation $ 166,200 $ 146,200 11 Net Fixed Assets S 360,800 $ 344,800 12 Total Assets $ 1,650,800 $ 1.468.800 13 Liabilities and Owner's Equity 14 Accounts Payable $ 175,200 $ 145,600 15 Short-term Notes Payable $ 225,000 $ 200,000 Other Current Liabilities $ 140,000 $ 136,000 17 Total Current Liabilities $ 540,200 $ 481,600 18 Long-term Debt $ 424,612 $ 323,432 19 Total Liabilities $ 964,812 $ 805,032 20 Common Stock $ 460,000 $ 460,000 Retained Earnings $ 225,988 S 203,768 22 Total Shareholder's Equity S 685,988 S 663,768 23 Total Liabilities and Owner's Equity S 1,650,800 $ 1,468,800 Instructions Income Statement Balance Sheet Statement of Cash Flows... 16 21 Review View HIP SECI F G H b c D E As of Dec. 31, 2009 Assets 2009 2008 Cash and Equivalents $ 52,000 $ 57,600 Accounts Receivable L S 402,000 $ 351,200 Inventory S 836,000 $ 715,200 Total Current Assets $ 1.290,000 $ 1,124,000 Plant & Equipment $ 527,000 $ 491,000 Accumulated Depreciation $ 166,200 $ 146,200 Net Fixed Assets $360,800 $ 344,800 Total Assets $1,650.800 $ 1.468.800 Liabilities and Owner's Equity Accounts Payable $ 175,200 $ 145,600 Short-term Notes Payable $ 225,000 $ 200,000 Other Current Liabilities S 140.000 $ 136,000 7 Total Current Liabilities S 540,200 $ 481,600 Long-term Debt S 424,612 S 323,432 9 Total Liabilities S 964,812 S 805,032 Common Stock $ 460,000 $ O 460,000 Retained Earnings $ 225,988 S 203,768 $ 685,988 $ 663,768 2 Total Shareholder's Equity Total Liabilities and Owner's Equity $1,650,800 $ 1,468,800 Income Statement Balance Sheet Statement of Cash Flows D CA B C Camelot Inc Statement of Cash Flows For the Year Ended Dec. 31, 2009 (S in 000's) 4 Cash Flows from Operations 5 Net Income S 44.220 6 Depreciation Expense $ 20,000 20,000 7 Change in Accounts Receivable $ (50.800) 8 Change in Inventories S (120.800) 9 Change in Accounts Payable S 29,600 10 Change in Other Current Liabilities 11 Total Cash Flows from Operations (73.780 12 Cash Flows from Investing 13 Change in Plant & Equipment 14 Total Cash Flows from Investing $ (36.000) 15 Cash Flows from Financing 16 Change in Short-term Notes Payable $ 25.000 17 Change in Long-term Debt $ 101,180 18 Change in Common Stock 19 Cash Dividends Paid to Shareholders (22,000) $ 104,180 20 Total Cash Flows from Financing (5,600) 21 Net Change in Cash Balance ... Income Statement Balance Sheet Statement of Cash Flows