

Answered step by step
Verified Expert Solution
Question
1 Approved Answer
Please solve as it there were no multiple choice options or available graphing calculators. (: Use a graphing calculator to plot the data and find
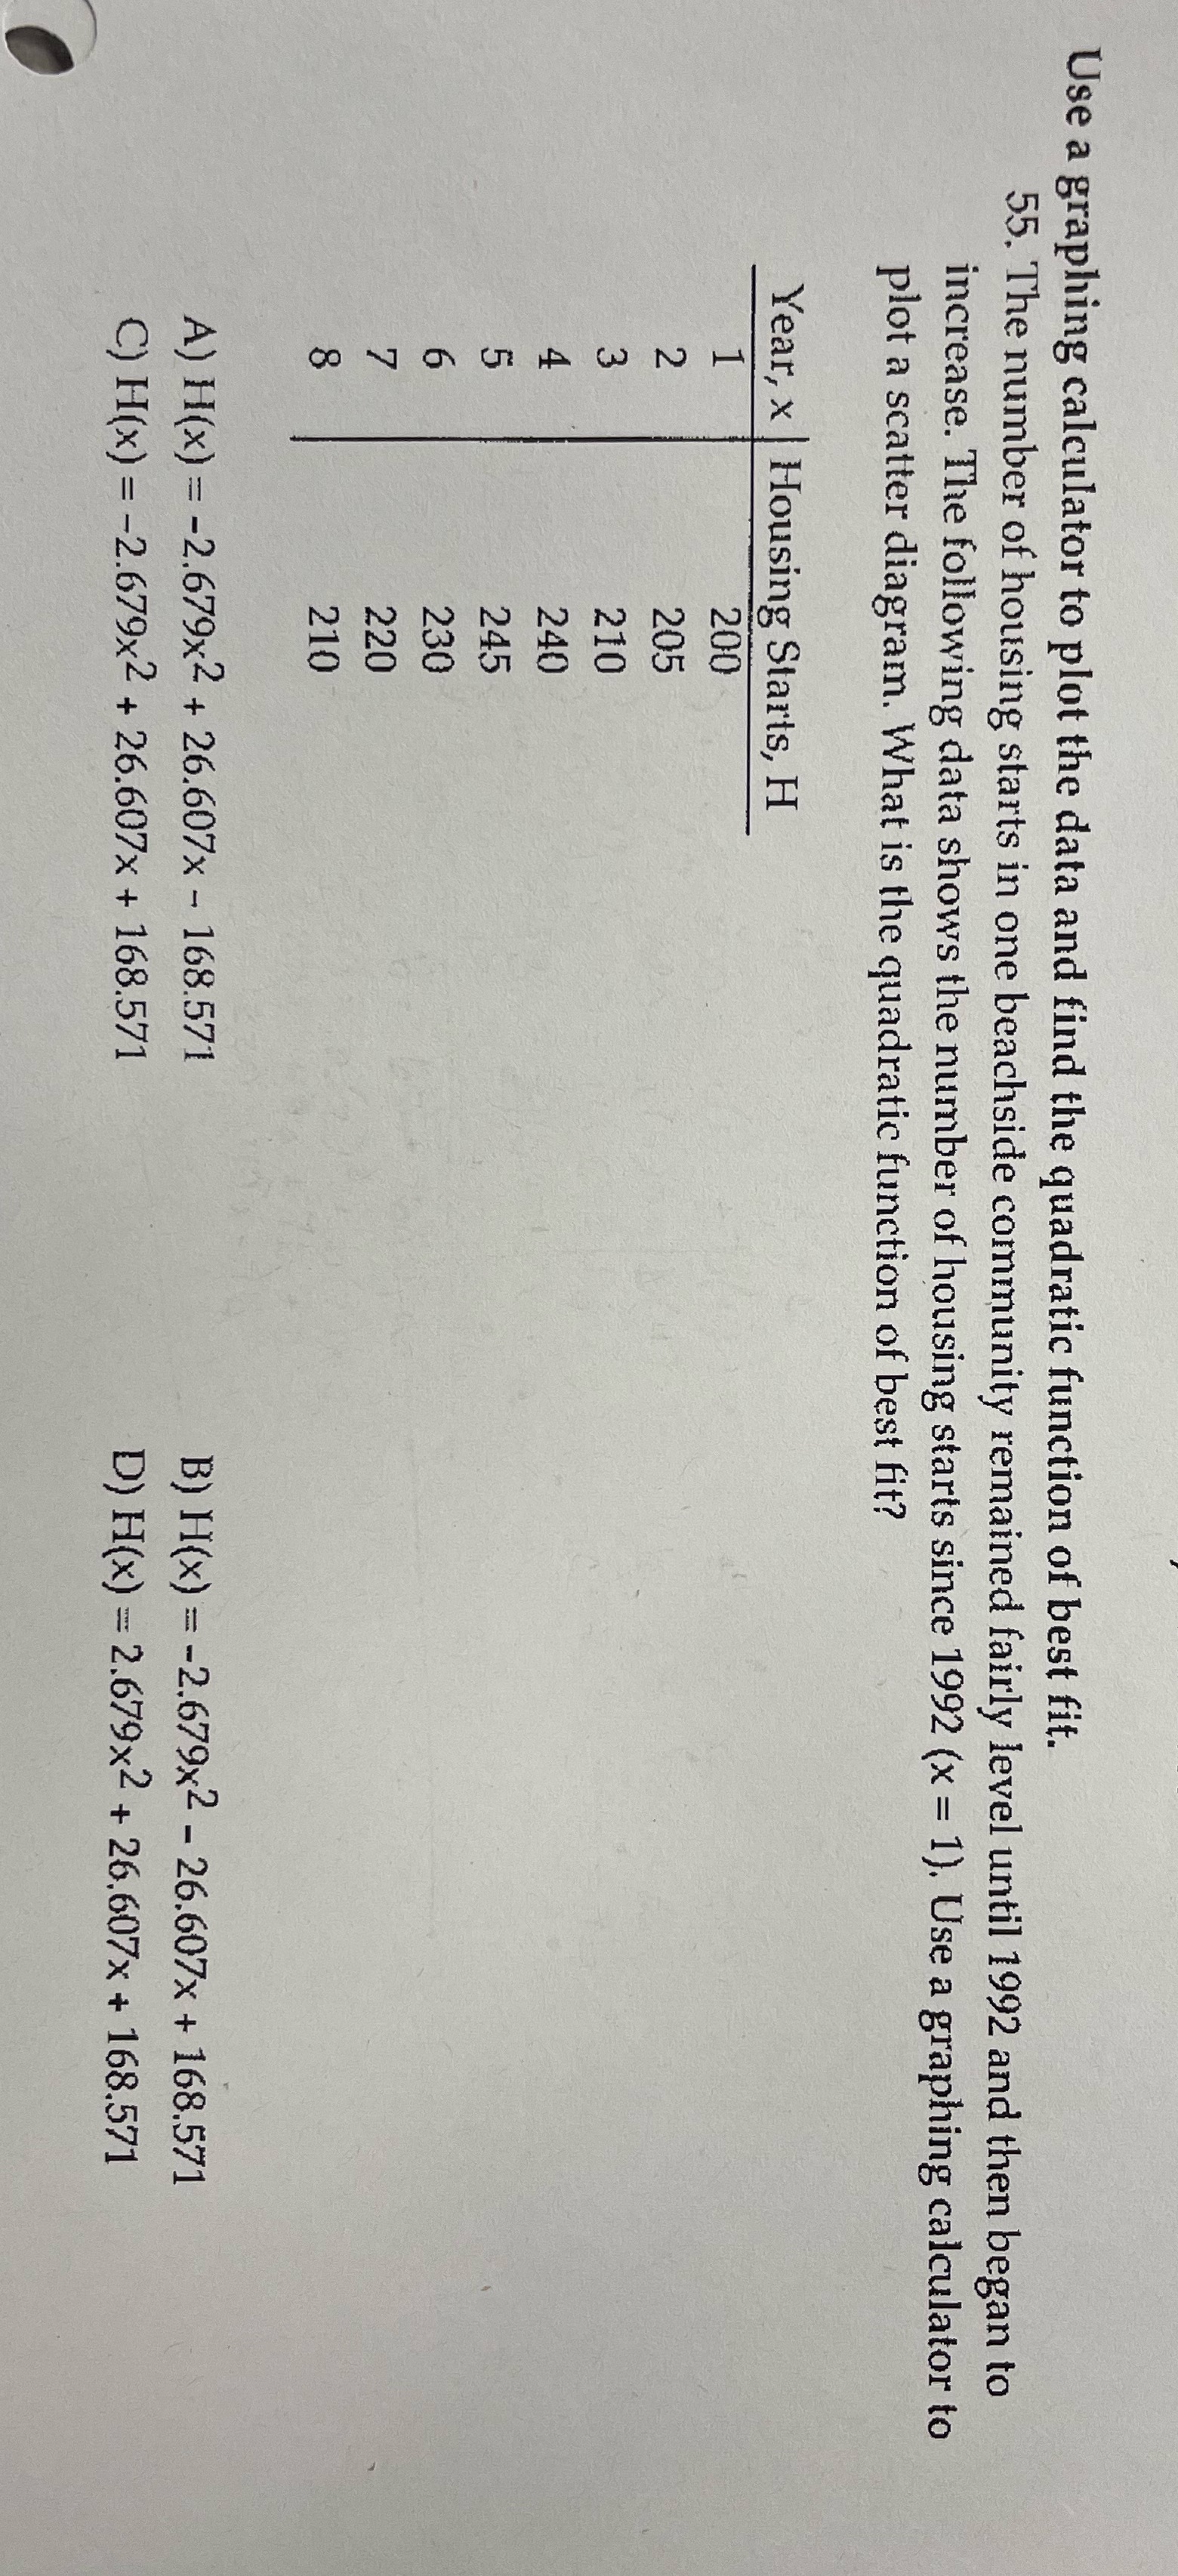
Please solve as it there were no multiple choice options or available graphing calculators. (:

Step by Step Solution
There are 3 Steps involved in it
Step: 1

Get Instant Access to Expert-Tailored Solutions
See step-by-step solutions with expert insights and AI powered tools for academic success
Step: 2

Step: 3
Ace Your Homework with AI
Get the answers you need in no time with our AI-driven, step-by-step assistance
Get Started
General Topology
Authors: Stephen Willard
1st Edition
0486131785, 9780486131788