Answered step by step
Verified Expert Solution
Question
1 Approved Answer
Please solve it? If there is any problem with the question then please write something in the commebt that is missing. However the question is


Please solve it? If there is any problem with the question then please write something in the commebt that is missing. However the question is complete.
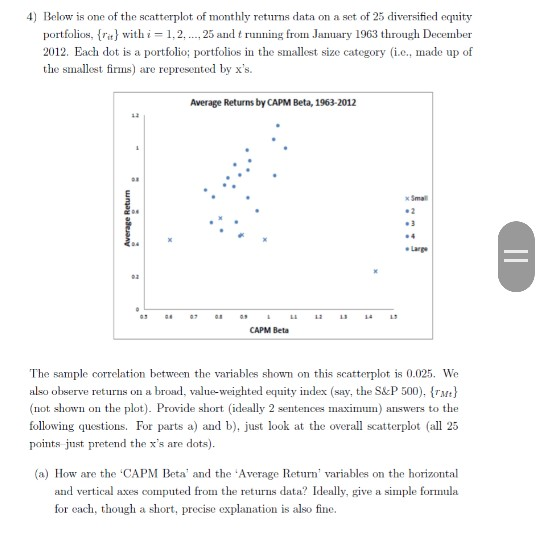
4) Below is one of the scatterplot of monthly returns data on a set of 25 diversified equity portfolios.(with i-1, 2, 25 and t running from January 1963 through December 2012. Each dot is a portfolio; portfolios in the smallest size category(i.e., made up of the smallest firms) are represented by x's. Average Returns by CAPM Beta, 1963-2012 xSmal Large CAPM Beta The sample correlation between the variables shown on this scatterplot is 0.025. We also observe returns on a broad, value-weighted equity index (say, the S&P 500), rt (not shown on the plot). Provide short ideally 2 sentences maxim) answers to the following questions. For parts a) and b), just look at the overall scatterplot (all 25 points just pretend the x's are dots) (a) How are the CAPM Beta and the 'Average Return variables on the horizontal and vertical axes computed from the retus data? Ideally, give a simple forula for each, though a short, precise explanation is also fine. (b) According to CAPM, what is the relationship between the average returns and betas? Does this expected relationship hold in the data? (c) If we decide to re-run the analysis sing only the four largest size categories (i.e. discard the five x's), do we get au auswer that is more or lessin le with what we are 'supposed' to see (ef. part b))? Explain whyStep by Step Solution
There are 3 Steps involved in it
Step: 1

Get Instant Access to Expert-Tailored Solutions
See step-by-step solutions with expert insights and AI powered tools for academic success
Step: 2

Step: 3

Ace Your Homework with AI
Get the answers you need in no time with our AI-driven, step-by-step assistance
Get Started


