

Answered step by step
Verified Expert Solution
Question
1 Approved Answer
Please solve question 5 (a-h) Thank you!! B E A 1 Office Supply Revenue Analysis 2 3 Revenue Amount $ 74,605.93 Assumptions (based on last
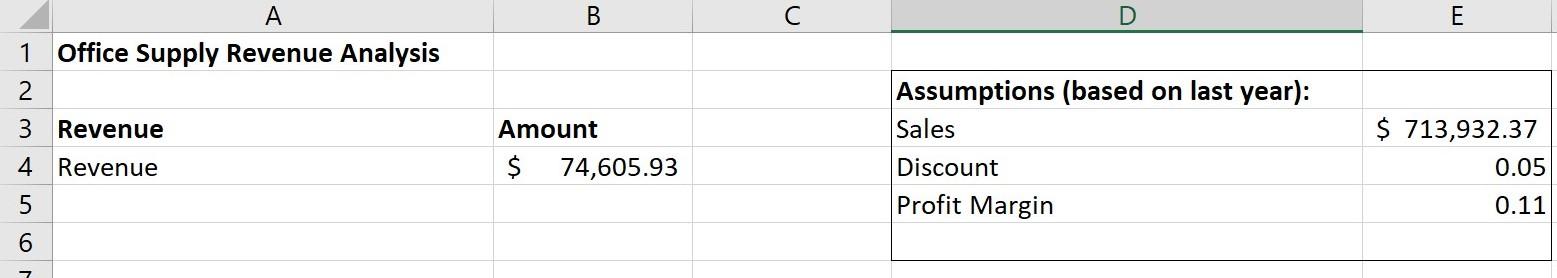
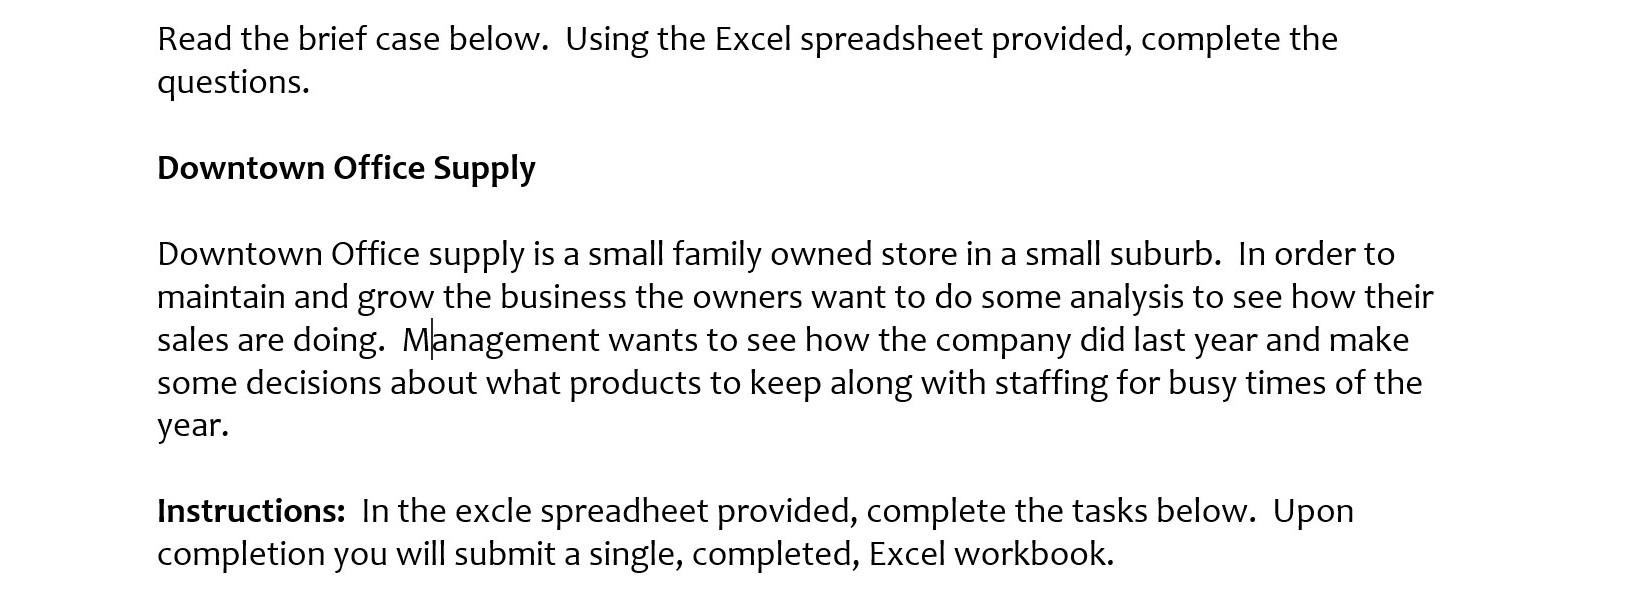
Please solve question 5 (a-h)
Thank you!!
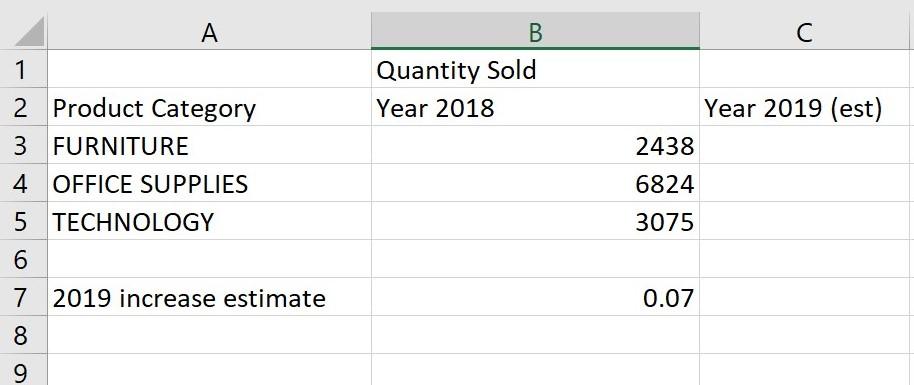
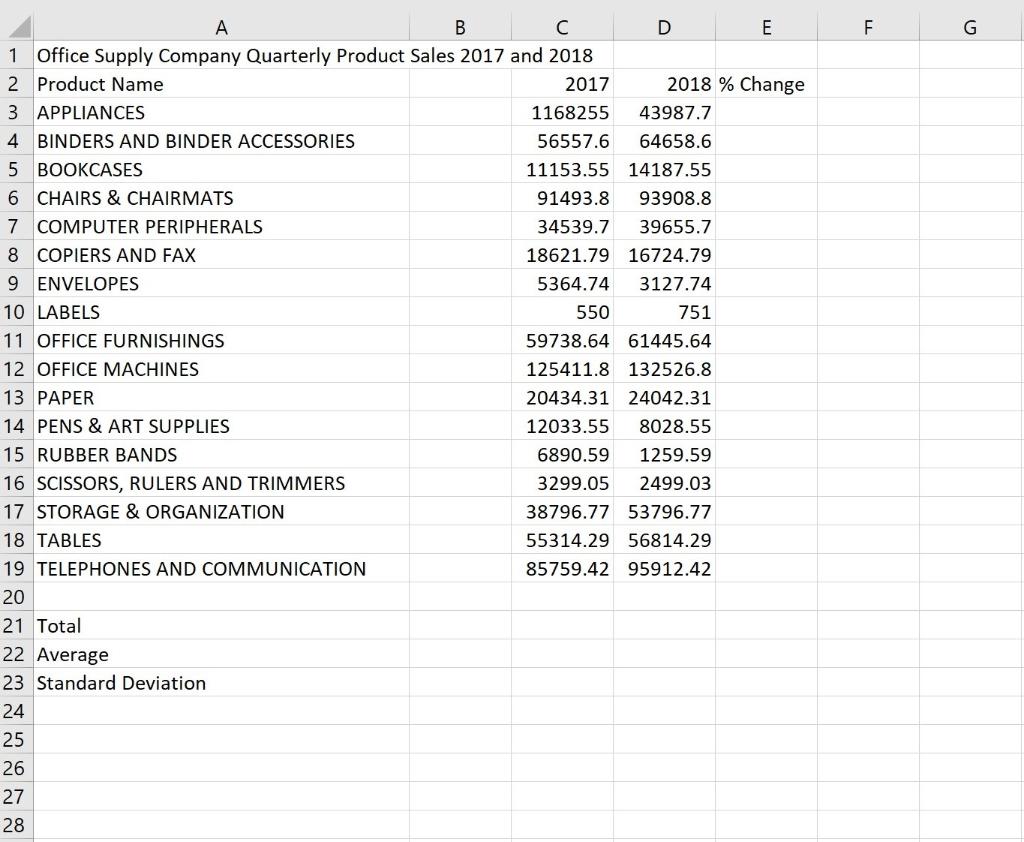
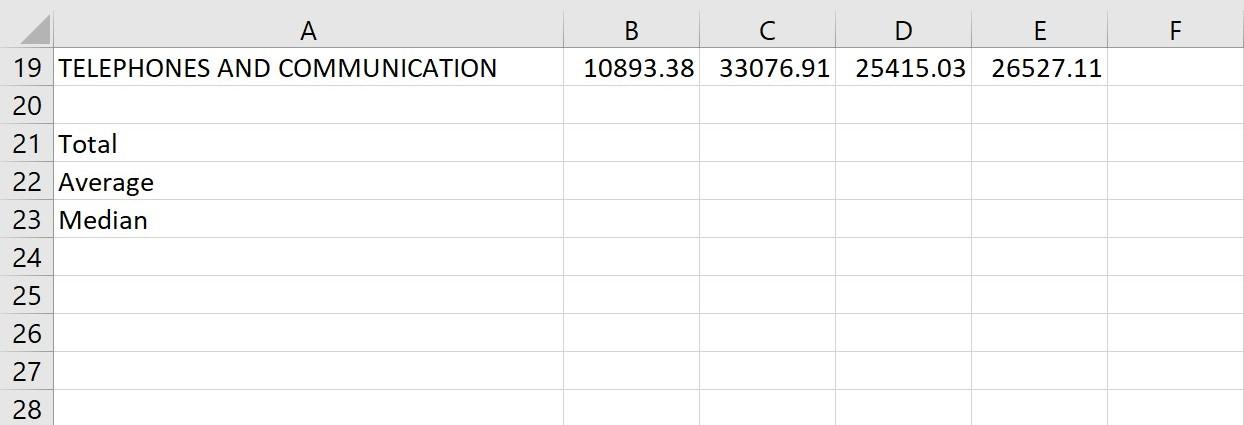
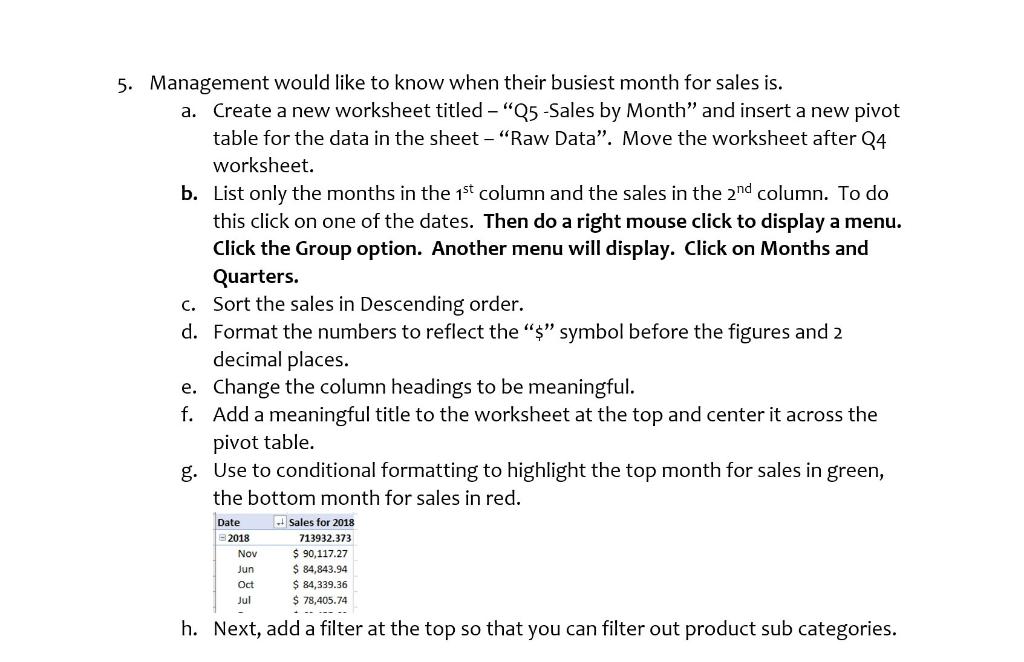
B E A 1 Office Supply Revenue Analysis 2 3 Revenue Amount $ 74,605.93 Assumptions (based on last year): Sales Discount Profit Margin $ 713,932.37 0.05 4 Revenue 0.11 7 B Quantity Sold Year 2018 . 1 2 Product Category 3 FURNITURE 4 OFFICE SUPPLIES 5 TECHNOLOGY 6 7 2019 increase estimate 8 Year 2019 (est) 2438 6824 3075 0.07 9 E LL G A B C D 1 Office Supply Company Quarterly Product Sales 2017 and 2018 2 Product Name 2017 2018 % Change 3 APPLIANCES 1168255 43987.7 4 BINDERS AND BINDER ACCESSORIES 56557.6 64658.6 5 BOOKCASES 11153.55 14187.55 6 CHAIRS & CHAIRMATS 91493.8 93908.8 7 COMPUTER PERIPHERALS 34539.7 39655.7 8 COPIERS AND FAX 18621.79 16724.79 9 ENVELOPES 5364.74 3127.74 10 LABELS 550 751 11 OFFICE FURNISHINGS 59738.64 61445.64 12 OFFICE MACHINES 125411.8 132526.8 13 PAPER 20434.31 24042.31 14 PENS & ART SUPPLIES 12033.55 8028.55 15 RUBBER BANDS 6890.59 1259.59 16 SCISSORS, RULERS AND TRIMMERS 3299.05 2499.03 17 STORAGE & ORGANIZATION 38796.77 53796.77 18 TABLES 55314.29 56814.29 19 TELEPHONES AND COMMUNICATION 85759.42 95912.42 20 21 Total 22 Average 23 Standard Deviation 24 25 26 27 28 A B D E F 10893.38 33076.91 25415.03 26527.11 19 TELEPHONES AND COMMUNICATION 20 21 Total 22 Average 23 Median 24 25 26 27 28 Read the brief case below. Using the Excel spreadsheet provided, complete the questions. Downtown Office Supply Downtown Office supply is a small family owned store in a small suburb. In order to maintain and grow the business the owners want to do some analysis to see how their sales are doing. Management wants to see how the company did last year and make some decisions about what products to keep along with staffing for busy times of the year. Instructions: In the excle spreadheet provided, complete the tasks below. Upon completion you will submit a single, completed, Excel workbook. 5. Management would like to know when their busiest month for sales is. a. Create a new worksheet titled - "Q5 -Sales by Month" and insert a new pivot table for the data in the sheet - "Raw Data". Move the worksheet after 04 worksheet. b. List only the months in the 1st column and the sales in the 2nd column. To do this click on one of the dates. Then do a right mouse click to display a menu. Click the Group option. Another menu will display. Click on Months and Quarters. C. Sort the sales in Descending order. d. Format the numbers to reflect the "$" symbol before the figures and 2 decimal places. e. Change the column headings to be meaningful. f. Add a meaningful title to the worksheet at the top and center it across the pivot table. g. Use to conditional formatting to highlight the top month for sales in green, the bottom month for sales in red. Date 2018 Nov Sales for 2018 713932.373 $ 90,117.27 $ 84,843.94 $ 84,339.36 $ 78,405.74 Jun Oct Jul h. Next, add a filter at the top so that you can filter out product sub categories. B E A 1 Office Supply Revenue Analysis 2 3 Revenue Amount $ 74,605.93 Assumptions (based on last year): Sales Discount Profit Margin $ 713,932.37 0.05 4 Revenue 0.11 7 B Quantity Sold Year 2018 . 1 2 Product Category 3 FURNITURE 4 OFFICE SUPPLIES 5 TECHNOLOGY 6 7 2019 increase estimate 8 Year 2019 (est) 2438 6824 3075 0.07 9 E LL G A B C D 1 Office Supply Company Quarterly Product Sales 2017 and 2018 2 Product Name 2017 2018 % Change 3 APPLIANCES 1168255 43987.7 4 BINDERS AND BINDER ACCESSORIES 56557.6 64658.6 5 BOOKCASES 11153.55 14187.55 6 CHAIRS & CHAIRMATS 91493.8 93908.8 7 COMPUTER PERIPHERALS 34539.7 39655.7 8 COPIERS AND FAX 18621.79 16724.79 9 ENVELOPES 5364.74 3127.74 10 LABELS 550 751 11 OFFICE FURNISHINGS 59738.64 61445.64 12 OFFICE MACHINES 125411.8 132526.8 13 PAPER 20434.31 24042.31 14 PENS & ART SUPPLIES 12033.55 8028.55 15 RUBBER BANDS 6890.59 1259.59 16 SCISSORS, RULERS AND TRIMMERS 3299.05 2499.03 17 STORAGE & ORGANIZATION 38796.77 53796.77 18 TABLES 55314.29 56814.29 19 TELEPHONES AND COMMUNICATION 85759.42 95912.42 20 21 Total 22 Average 23 Standard Deviation 24 25 26 27 28 A B D E F 10893.38 33076.91 25415.03 26527.11 19 TELEPHONES AND COMMUNICATION 20 21 Total 22 Average 23 Median 24 25 26 27 28 Read the brief case below. Using the Excel spreadsheet provided, complete the questions. Downtown Office Supply Downtown Office supply is a small family owned store in a small suburb. In order to maintain and grow the business the owners want to do some analysis to see how their sales are doing. Management wants to see how the company did last year and make some decisions about what products to keep along with staffing for busy times of the year. Instructions: In the excle spreadheet provided, complete the tasks below. Upon completion you will submit a single, completed, Excel workbook. 5. Management would like to know when their busiest month for sales is. a. Create a new worksheet titled - "Q5 -Sales by Month" and insert a new pivot table for the data in the sheet - "Raw Data". Move the worksheet after 04 worksheet. b. List only the months in the 1st column and the sales in the 2nd column. To do this click on one of the dates. Then do a right mouse click to display a menu. Click the Group option. Another menu will display. Click on Months and Quarters. C. Sort the sales in Descending order. d. Format the numbers to reflect the "$" symbol before the figures and 2 decimal places. e. Change the column headings to be meaningful. f. Add a meaningful title to the worksheet at the top and center it across the pivot table. g. Use to conditional formatting to highlight the top month for sales in green, the bottom month for sales in red. Date 2018 Nov Sales for 2018 713932.373 $ 90,117.27 $ 84,843.94 $ 84,339.36 $ 78,405.74 Jun Oct Jul h. Next, add a filter at the top so that you can filter out product sub categoriesStep by Step Solution
There are 3 Steps involved in it
Step: 1

Get Instant Access to Expert-Tailored Solutions
See step-by-step solutions with expert insights and AI powered tools for academic success
Step: 2

Step: 3
Ace Your Homework with AI
Get the answers you need in no time with our AI-driven, step-by-step assistance
Get Started
The Essentials Of Finance And Accounting For Nonfinancial Managers
Authors: Edward Fields
3rd Edition
0814436943, 9780814436943