please solve these statistics questions for me. thank you so much, i will really appreciate it.
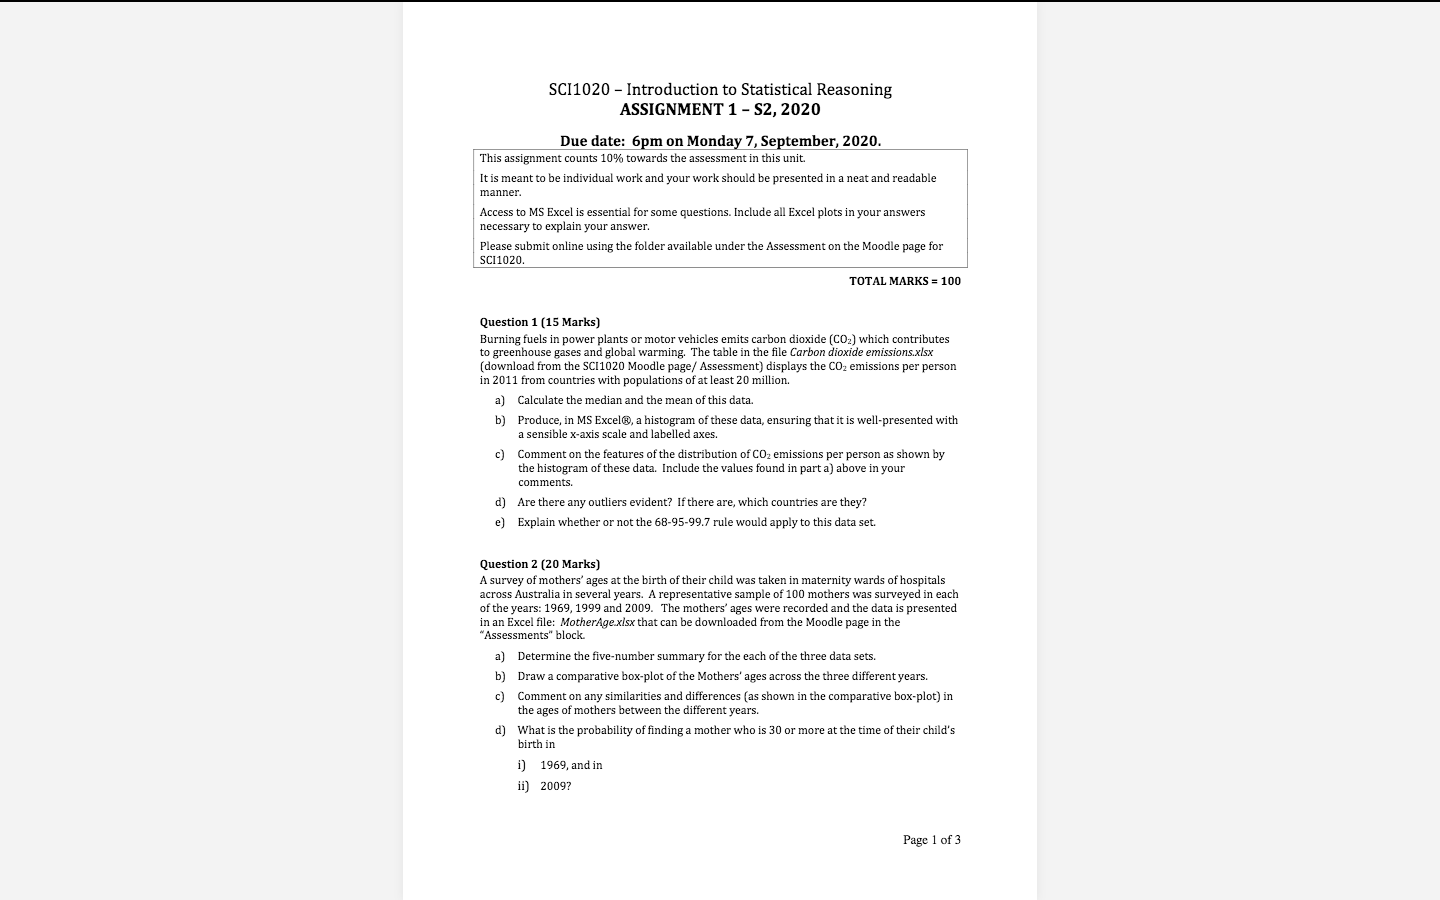
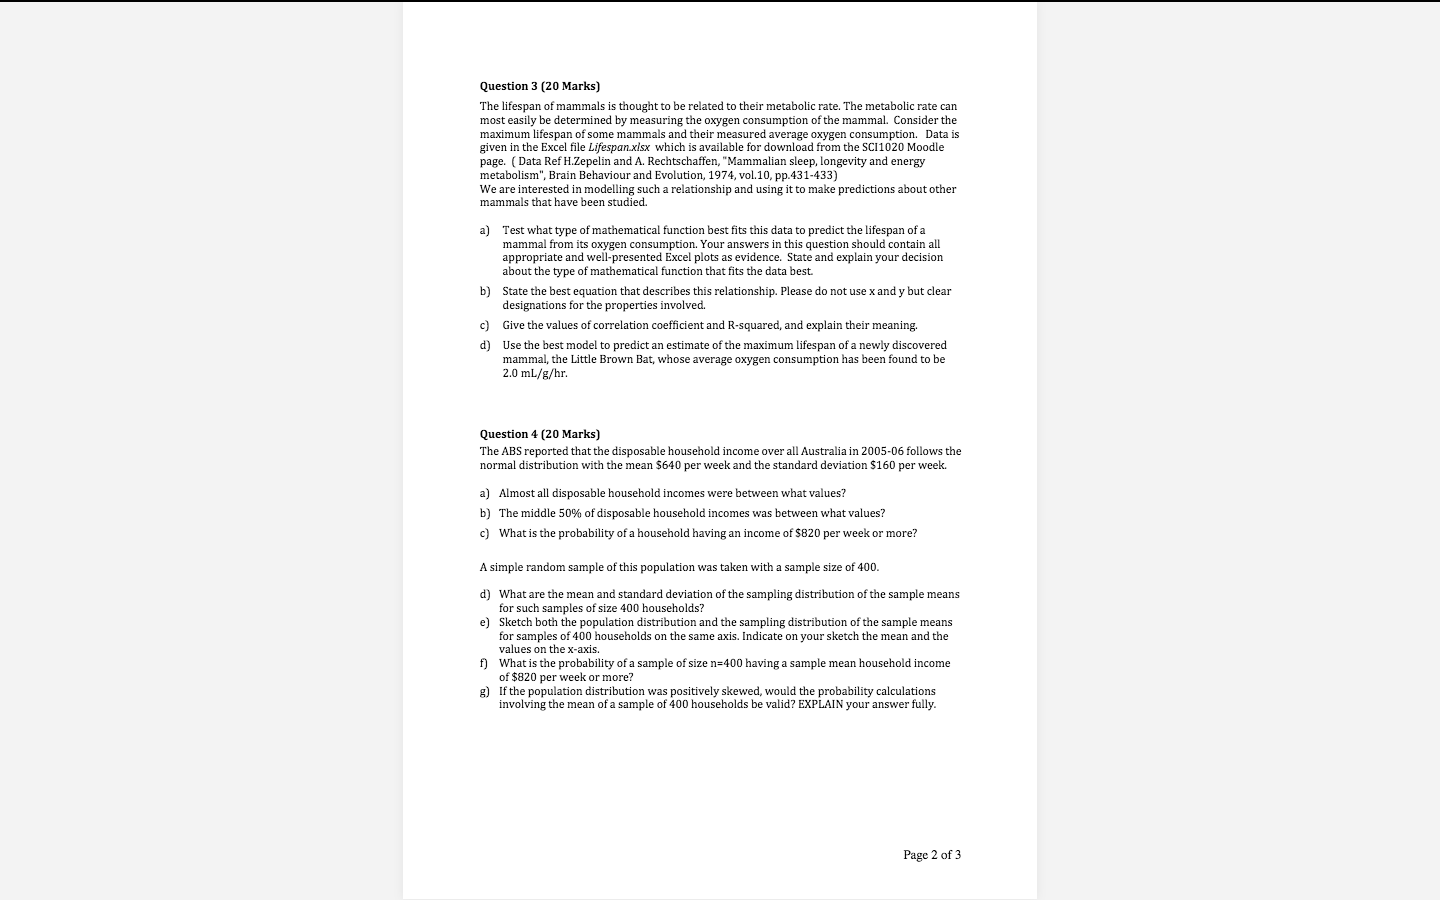
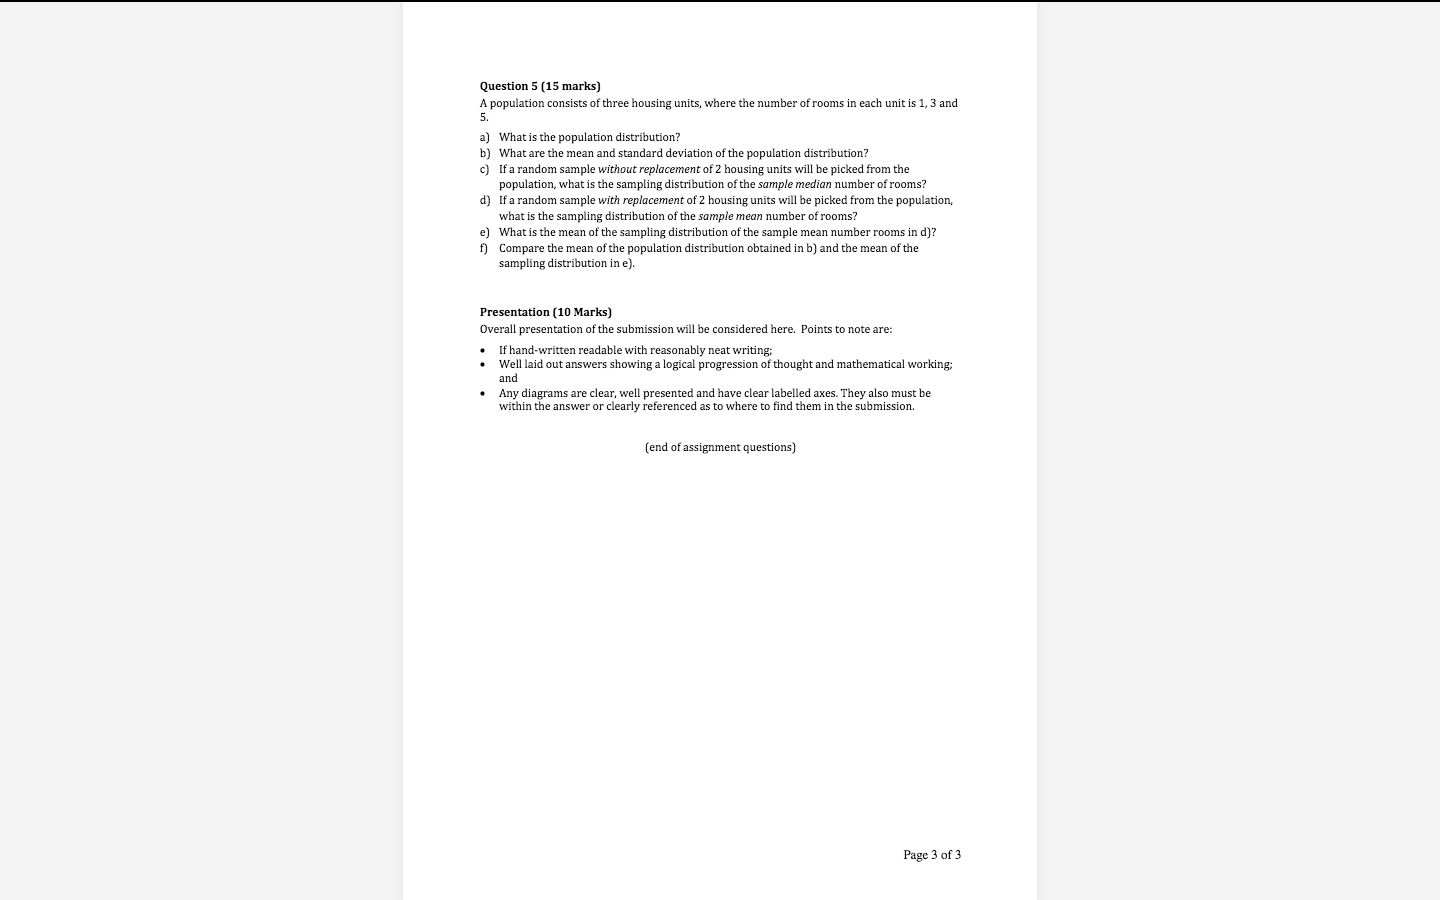
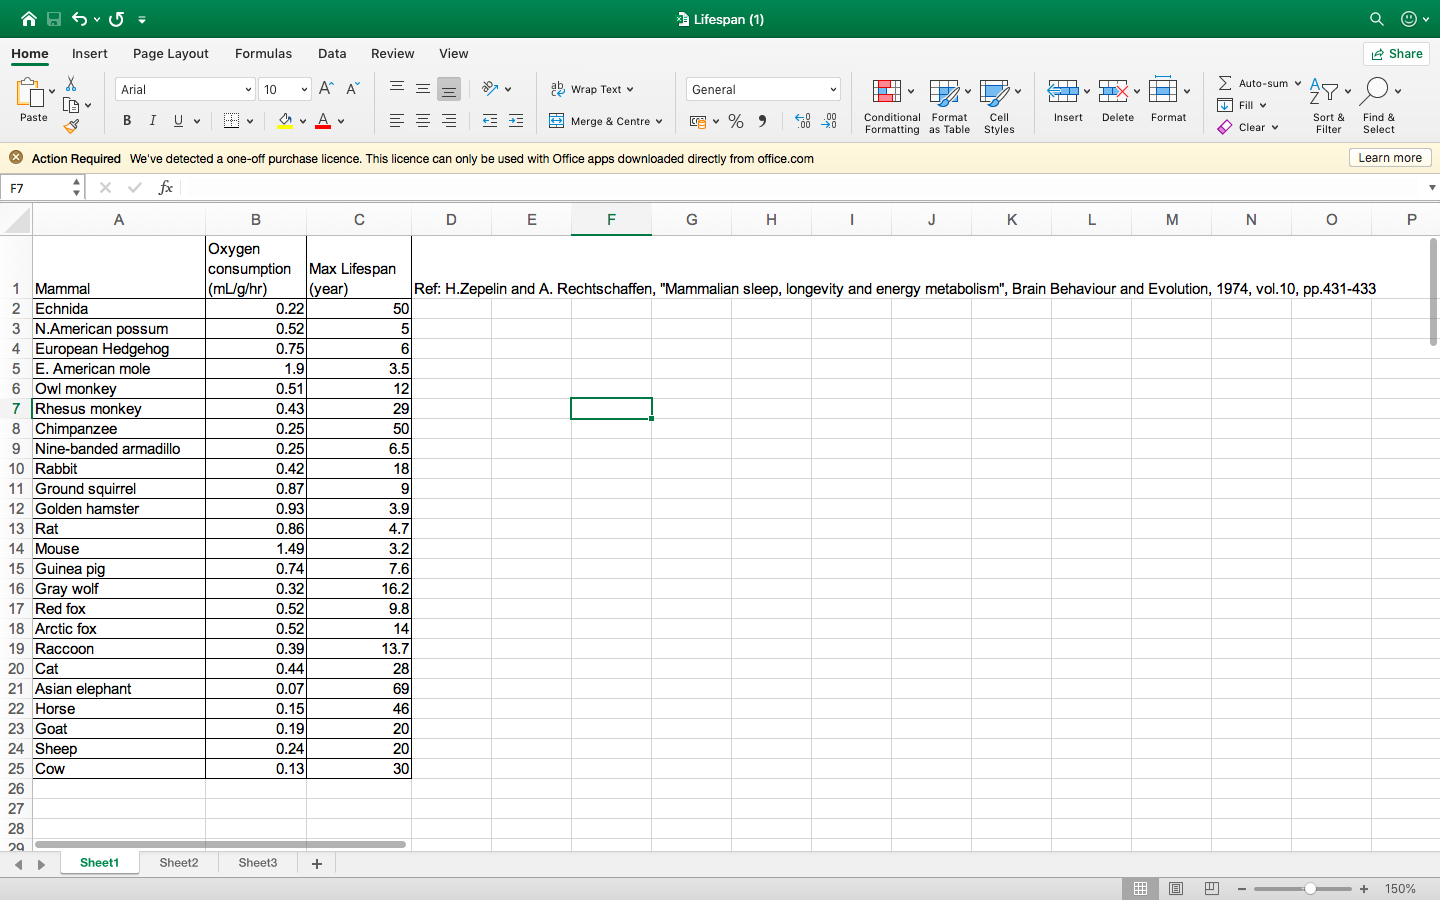
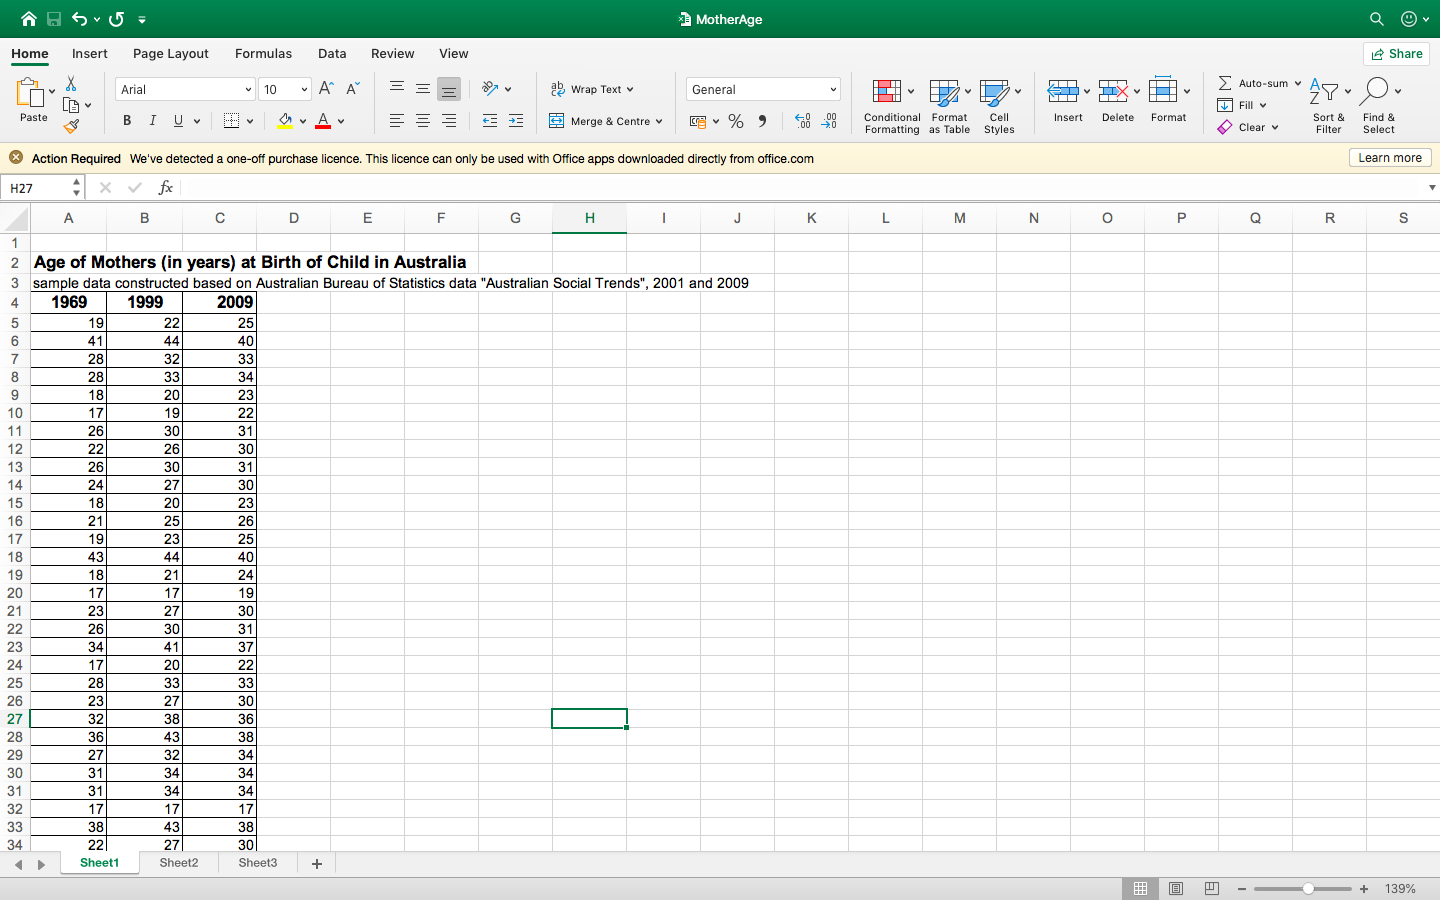
SCI1020 - Introduction to Statistical Reasoning ASSIGNMENT 1 - $2, 2020 Due date: 6pm on Monday 7, September, 2020. This assignment counts 10% towards the assessment in this unit. It is meant to be individual work and your work should be presented in a neat and readable manner. Access to MS Excel is essential for some questions. Include all Excel plots in your answers necessary to explain your answer. SCI1020. Please submit online using the folder available under the Assessment on the Moodle page for TOTAL MARKS = 100 Question 1 (15 Marks) Burning fuels in power plants or motor vehicles emits carbon dioxide (CO2) which contributes to greenhouse gases and global warming. The table in the file Carbon dioxide emissions.xisx download from the SCI1020 Moodle page/ Assessment] displays the CO2 emissions per person in 2011 from countries with populations of at least 20 million. a) Calculate the median and the mean of this data. b) Produce, in MS Excel@, a histogram of these data, ensuring that it is well-presented with a sensible x-axis scale and labelled axes. c) Comment on the features of the distribution of COz emissions per person as shown by the histogram of these data. Include the values found in part a) above in your comments. d) Are there any outliers evident? If there are, which countries are they? e) Explain whether or not the 68-95-99.7 rule would apply to this data set. Question 2 (20 Marks) A survey of mothers' ages at the birth of their child was taken in maternity wards of hospitals across Australia in several years. A representative sample of 100 mothers was surveyed in each of the years: 1969, 1999 and 2009. The mothers' ages were recorded and the data is presented in an Excel file: MotherAge xisx that can be downloaded from the Moodle page in the Assessments" block. a) Determine the five-number summary for the each of the three data sets b) Draw a comparative box-plot of the Mothers' ages across the three different years. c) Comment on any similarities and differences (as shown in the comparative box-plot) in the ages of mothers between the different years. What is the probability of finding a mother who is 30 or more at the time of their child's birth in i) 1969, and in ii) 2009? Page 1 of 3Question 3 (20 Marks) The lifespan of mammals is thought to be related to their metabolic rate. The metabolic rate can most easily be determined by measuring the oxygen consumption of the mammal. Consider the maximum lifespan of some mammals and their measured average oxygen consumption. Data is given in the Excel file Lifespan xisx which is available for download from the SCI1020 Moodle page. ( Data Ref H.Zepelin and A. Rechtschaffen, "Mammalian sleep, longevity and energy metabolism", Brain Behaviour and Evolution, 1974, vol.10, pp.431-433) We are interested in modelling such a relationship and using it to make predictions about other mammals that have been studied. a) Test what type of mathematical function best fits this data to predict the lifespan of a mammal from its oxygen consumption. Your answers in this question should contain all appropriate and well-presented Excel plots as evidence. State and explain your decision about the type of mathematical function that fits the data best. b) State the best equation that describes this relationship. Please do not use x and y but clear designations for the properties involved. c) Give the values of correlation coefficient and R-squared, and explain their meaning. d) Use the best model to predict an estimate of the maximum lifespan of a newly discovered mammal, the Little Brown Bat, whose average oxygen consumption has been found to be 2.0 mL/g/hr. Question 4 (20 Marks) The ABS reported that the disposable household income over all Australia in 2005-06 follows the normal distribution with the mean $640 per week and the standard deviation $160 per week. a) Almost all disposable household incomes were between what values? b) The middle 50% of disposable household incomes was between what values? c) What is the probability of a household having an income of $820 per week or more? A simple random sample of this population was taken with a sample size of 400. d) What are the mean and standard deviation of the sampling distribution of the sample means for such samples of size 400 households? e) Sketch both the population distribution and the sampling distribution of the sample means for samples of 400 households on the same axis. Indicate on your sketch the mean and the values on the x-axis. f) What is the probability of a sample of size n=400 having a sample mean household income of $820 per week or more? g) If the population distribution was positively skewed, would the probability calculations involving the mean of a sample of 400 households be valid? EXPLAIN your answer fully. Page 2 of 3Question 5 (15 marks) A population consists of three housing units, where the number of rooms in each unit is 1, 3 and 5. a) What is the population distribution? b) What are the mean and standard deviation of the population distribution? c) If a random sample without replacement of 2 housing units will be picked from the population, what is the sampling distribution of the sample median number of rooms? d) If a random sample with replacement of 2 housing units will be picked from the population, what is the sampling distribution of the sample mean number of rooms? e) What is the mean of the sampling distribution of the sample mean number rooms in d)? f) Compare the mean of the population distribution obtained in b) and the mean of the sampling distribution in e). Presentation (10 Marks) Overall presentation of the submission will be considered here. Points to note are: If hand-written readable with reasonably neat writing; Well laid out answers showing a logical progression of thought and mathematical working; and Any diagrams are clear, well presented and have clear labelled axes. They also must be within the answer or clearly referenced as to where to find them in the submission. (end of assignment questions) Page 3 of 31 Carbon dioxide emissions (1) Q Q v Home Insert Page Layout Formulas Data Review View Share Verdana 10 AA = = ap Wrap Text v General 2 Auto-sum AY - O. Paste BIU Y OvAv Fill Merge & Centre v [ ~ % " Conditional Format Cell Insert Delete Format Clear v Sort & Find & Formatting as Table Styles Filter Select Action Required We've detected a one-off purchase licence. This licence can only be used with Office apps downloaded directly from office.com Learn more A1 x fx Country A C D E F G H J K L M N P Q R S T U V Carbon Dioxide emissions, Country tonnes per capita 2011 Ref: http://www.lea.org/publications/freepublications/publication/CO2Emissions Fr uelCombustionHighlights 2013.pdf Algeria 2.89 CO2 Emissions from Fuel Consumption Highlights (2013 edition) 3 Argentina 4.5 pp. 101-103 (IEA/OECD, 2013) Australia 17.43 5 Bangladesh 0.36 Brazil 2.07 Canada 15.37 8 China 5.92 9 Colombia 1.42 10 Congo 11 Egypt 0.3 2.28 12 Ethiopia 0.07 13 France 5.04 14 Germany 9.14 15 Ghana 0.43 16 India 1.41 17 Indonesia 1.76 18 Iran 6.97 19 Iraq 3.28 20 Italy 6.47 21 Japan 9.28 22 Kenya 0.28 23 Korea, North 2.65 24 Korea, South 11.81 25 Malaysia 6.72 26 Mexico 3.96 27 Morocco 1.55 28 Myanmar 0.17 29 Nepal 0.13 30 Nigeria 31 Pakistan 0.33 0.77 32 Peru 1.52 33 Philippines 0.81 34 Poland 7.79 35 Romania 3.82 36 Russian Federation 11.64 37 Saudi Arabia 16.28 38 South Africa 7.27 39 Spain 5.86 40 Sudan 0.33 41 Tanzania 0.14 42 Thailand 3.5 43 Turkey 3.86 44 Ukraine 6.24 45 United Kingdom 7.06 46 United States 47 Uzbekistan 16.94 3.76 48 Venezuela 5.44 49 Vietnam 1.56 50 Sheet1 Sheet2 Sheet3 + + 93%1 Lifespan (1) Q Q v Home Insert Page Layout Formulas Data Review View Share Arial 10 AA = = ap Wrap Text v General 2 Auto-sum Fill AY . O. Paste BIU BY OvAv EE Merge & Centre v ~ % " Conditional Format Cell Insert Delete Format Clear v Sort & Find & Formatting as Table Styles Filter Select * Action Required We've detected a one-off purchase licence. This licence can only be used with Office apps downloaded directly from office.com Learn more F7 + X V fx A B C D E F G H J K L M N O P Oxygen consumption Max Lifespan 1 Mammal (mL/g/hr) (year Ref: H.Zepelin and A. Rechtschaffen, "Mammalian sleep, longevity and energy metabolism", Brain Behaviour and Evolution, 1974, vol. 10, pp.431-433 2 Echnida 0.22 50 3 N.American possum 0.52 4 European Hedgehog 0.75 6 E. American mole 1.9 3.5 Owl monkey 0.51 12 7 Rhesus monkey 0.43 29 8 Chimpanzee 0.25 50 9 Nine-banded armadillo 0.25 6.5 10 Rabbit 0.42 18 11 Ground squirrel 0.87 9 12 Golden hamster 0.93 3.9 13 Rat 0.86 4.7 14 Mouse 1.49 3.2 15 Guinea pig 0.74 7.6 16 Gray wolf 0.32 16.2 17 Red fox 0.52 9.8 18 Arctic fox 0.52 14 19 Raccoon 0.39 13.7 20 Cat 0.44 28 21 Asian elephant 69 22 Horse 0.15 46 23 Goat 0.19 20 24 Sheep 0.24 20 25 Cow 0.13 30 26 27 28 29 Sheet1 Sheet2 Sheet3 + + 150%MotherAge Q Q v Home Data Review View Share Insert Page Layout Formulas 2 Auto-sum Arial 10 AA" = = ag Wrap Text v General Fill AY - O. Sort & Find & Paste BIU BY Merge & Centre v [ ~ % " Conditional Format Cell Insert Delete Format Formatting as Table Styles Clear v Filter Select Learn more Action Required We've detected a one-off purchase licence. This licence can only be used with Office apps downloaded directly from office.com H27 * X V fx A B C D E F G H I J K L M N O P Q R S Age of Mothers (in years) at Birth of Child in Australia sample data constructed based on Australian Bureau of Statistics data "Australian Social Trends", 2001 and 2009 1969 1999 2009 19 22 25 41 44 40 28 32 33 28 33 34 18 20 23 17 19 22 26 30 31 30 31 24 30 41 31 20 37 33 38 43 27 32 34 31 34 34 31 34 34 32 17 17 33 38 43 17 38 34 22 27 30 Sheet1 Sheet2 Sheet3 + - + 139%