

Answered step by step
Verified Expert Solution
Question
1 Approved Answer
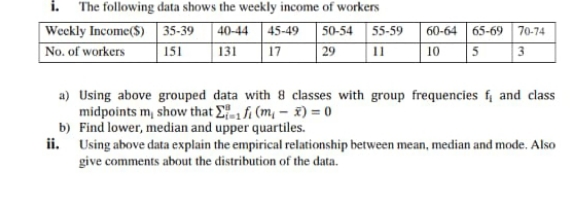
please solve this for me The following data shows the weekly income of workers Weekly Income($) 35-39 40-44 45-49 50-54 55-59 60-64 65-69 70-74 No.
please solve this for me
Step by Step Solution
There are 3 Steps involved in it
Step: 1

Get Instant Access to Expert-Tailored Solutions
See step-by-step solutions with expert insights and AI powered tools for academic success
Step: 2

Step: 3
Ace Your Homework with AI
Get the answers you need in no time with our AI-driven, step-by-step assistance
Get Started
Finite Mathematics and Its Applications
Authors: Larry J. Goldstein, David I. Schneider, Martha J. Siegel, Steven Hair
12th edition
978-0134768588, 9780134437767, 134768582, 134437764, 978-0134768632