
 please solve using excel and show work
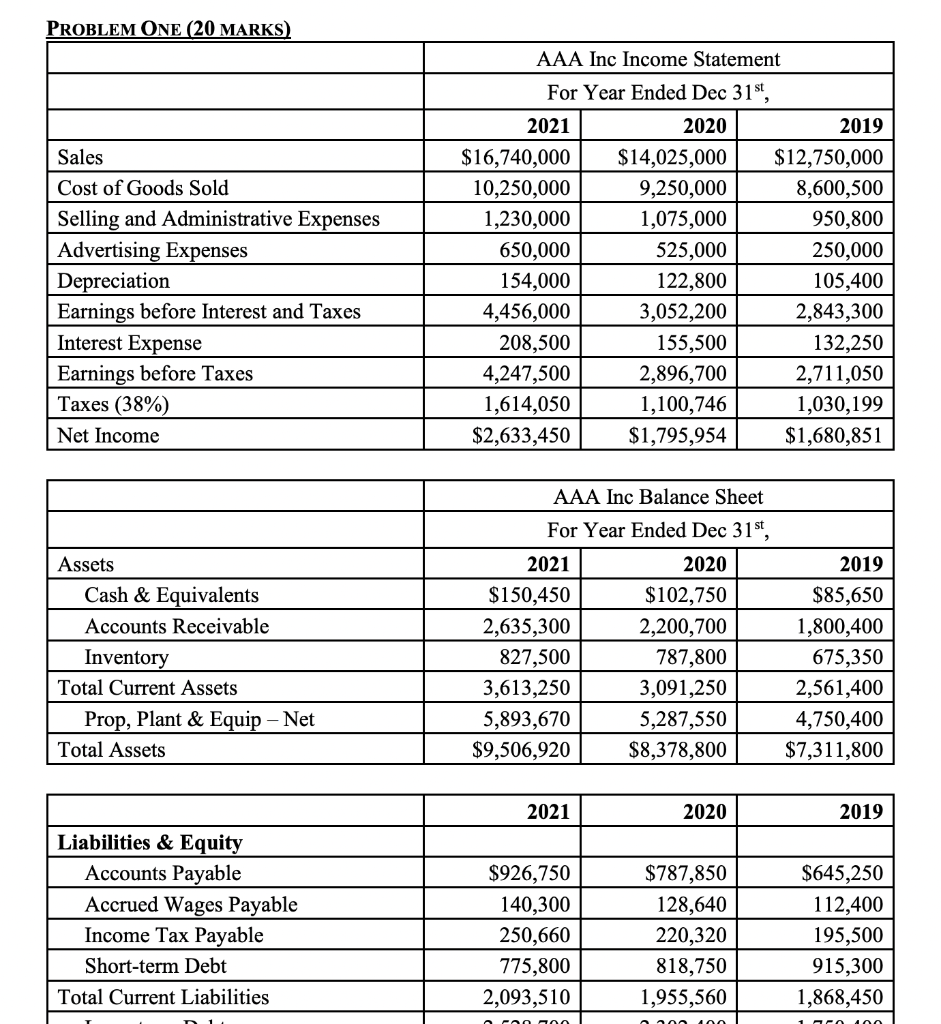
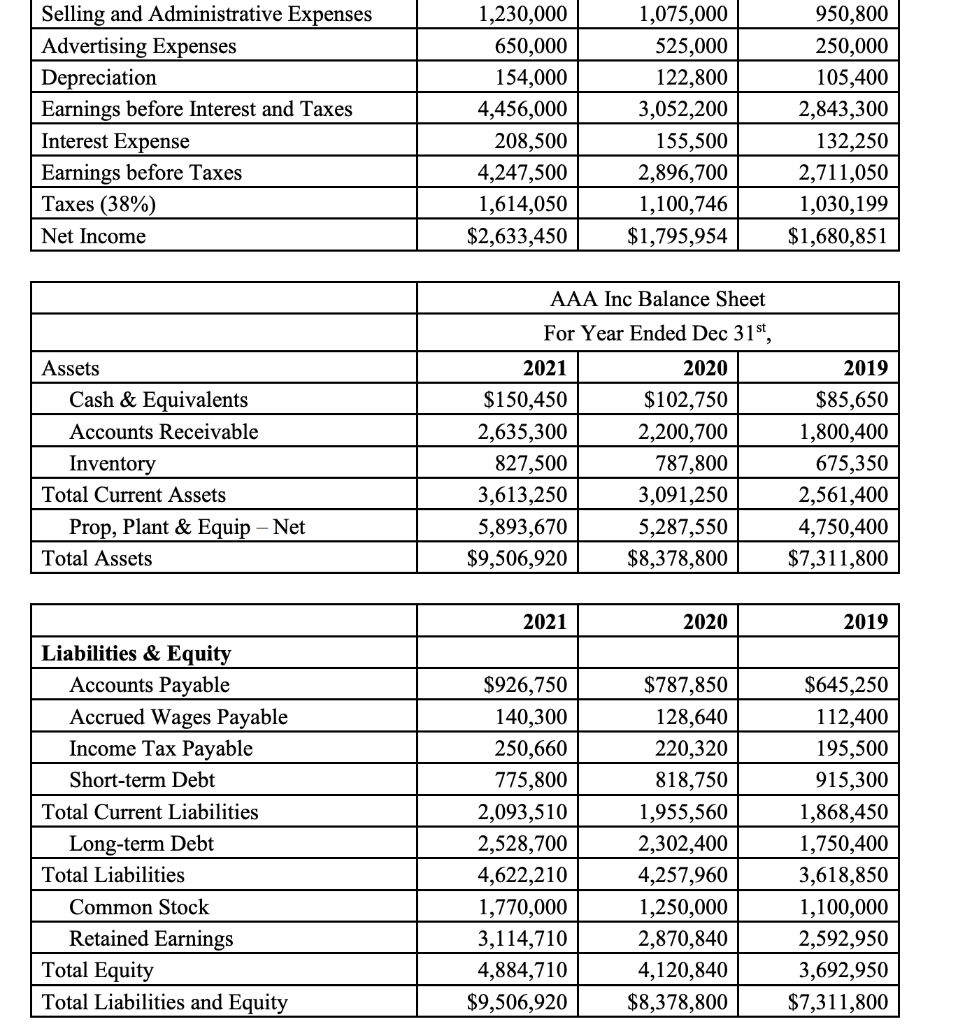
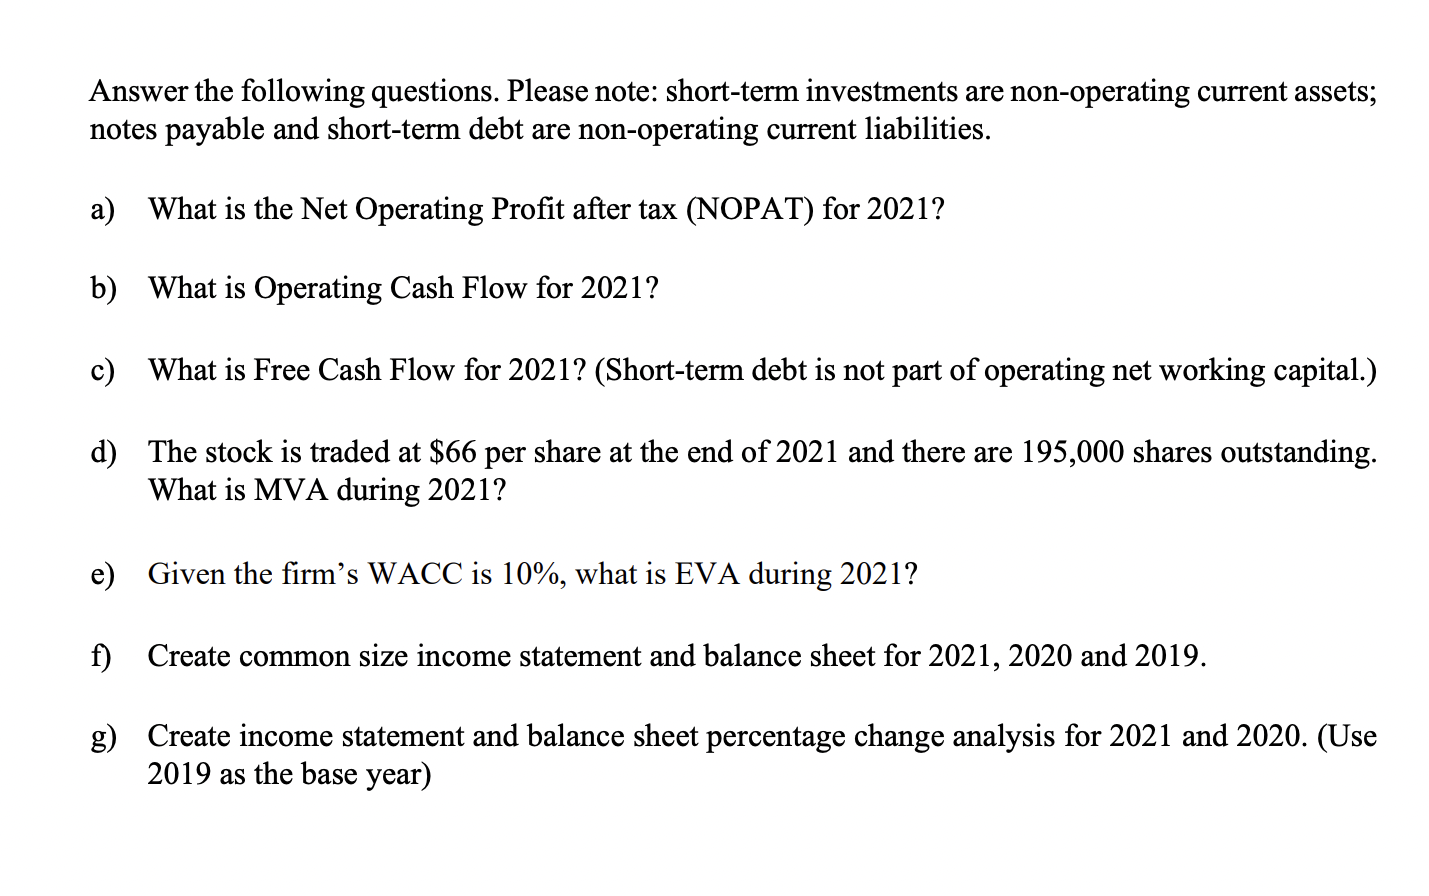
PROBLEM ONE (20 MARKS) Sales Cost of Goods Sold Selling and Administrative Expenses Advertising Expenses Depreciation Earnings before Interest and Taxes Interest Expense Earnings before Taxes Taxes (38%) Net Income AAA Inc Income Statement For Year Ended Dec 31st, 2021 2020 2019 $16,740,000 $14,025,000 $12,750,000 10,250,000 9,250,000 8,600,500 1,230,000 1,075,000 950,800 650,000 525,000 250,000 154,000 122,800 105,400 4,456,000 3,052,200 2,843,300 208,500 155,500 132,250 4,247,500 2,896,700 2,711,050 1,614,050 1,100,746 1,030,199 $2,633,450 $1,795,954 $1,680,851 AAA Inc Balance Sheet 2021 2019 Assets Cash & Equivalents Accounts Receivable Inventory Total Current Assets Prop, Plant & Equip - Net Total Assets For Year Ended Dec 31st, 2020 $150,450 $102,750 2,635,300 2,200,700 827,500 787,800 3,613,250 3,091,250 5,893,670 5,287,550 $9,506,920 $8,378,800 $85,650 1,800,400 675,350 2,561,400 4,750,400 $7,311,800 2021 2020 2019 Liabilities & Equity Accounts Payable Accrued Wages Payable Income Tax Payable Short-term Debt Total Current Liabilities $926,750 140,300 250,660 775,800 2,093,510 $787,850 128,640 220,320 818,750 1,955,560 $645,250 112,400 195,500 915,300 1,868,450 no Selling and Administrative Expenses Advertising Expenses Depreciation Earnings before Interest and Taxes Interest Expense Earnings before Taxes Taxes (38%) Net Income 1,230,000 650,000 154,000 4,456,000 208,500 4,247,500 1,614,050 $2,633,450 1,075,000 525,000 122,800 3,052,200 155,500 2,896,700 1,100,746 $1,795,954 950,800 250,000 105,400 2,843,300 132,250 2,711,050 1,030,199 $1,680,851 AAA Inc Balance Sheet For Year Ended Dec 31st, 2021 Assets Cash & Equivalents Accounts Receivable Inventory Total Current Assets Prop, Plant & Equip - Net Total Assets $150,450 2,635,300 827,500 3,613,250 5,893,670 $9,506,920 2020 $102,750 2,200,700 787,800 3,091,250 5,287,550 $8,378,800 2019 $85,650 1,800,400 675,350 2,561,400 4,750,400 $7,311,800 2021 2020 2019 Liabilities & Equity Accounts Payable Accrued Wages Payable Income Tax Payable Short-term Debt Total Current Liabilities Long-term Debt Total Liabilities Common Stock Retained Earnings Total Equity Total Liabilities and Equity $926,750 140,300 250,660 775,800 2,093,510 2,528,700 4,622,210 1,770,000 3,114,710 4,884,710 $9,506,920 $787,850 128,640 220,320 818,750 1,955,560 2,302,400 4,257,960 1,250,000 2,870,840 4,120,840 $8,378,800 $645,250 112,400 195,500 915,300 1,868,450 1,750,400 3,618,850 1,100,000 2,592,950 3,692,950 $7,311,800 Answer the following questions. Please note: short-term investments are non-operating current assets; notes payable and short-term debt are non-operating current liabilities. a) What is the Net Operating Profit after tax (NOPAT) for 2021? b) What is Operating Cash Flow for 2021? c) What is Free Cash Flow for 2021? (Short-term debt is not part of operating net working capital.) d) The stock is traded at $66 per share at the end of 2021 and there are 195,000 shares outstanding. What is MVA during 2021? e) Given the firm's WACC is 10%, what is EVA during 2021? f) Create common size income statement and balance sheet for 2021, 2020 and 2019. g) Create income statement and balance sheet percentage change analysis for 2021 and 2020. (Use 2019 as the base year) PROBLEM ONE (20 MARKS) Sales Cost of Goods Sold Selling and Administrative Expenses Advertising Expenses Depreciation Earnings before Interest and Taxes Interest Expense Earnings before Taxes Taxes (38%) Net Income AAA Inc Income Statement For Year Ended Dec 31st, 2021 2020 2019 $16,740,000 $14,025,000 $12,750,000 10,250,000 9,250,000 8,600,500 1,230,000 1,075,000 950,800 650,000 525,000 250,000 154,000 122,800 105,400 4,456,000 3,052,200 2,843,300 208,500 155,500 132,250 4,247,500 2,896,700 2,711,050 1,614,050 1,100,746 1,030,199 $2,633,450 $1,795,954 $1,680,851 AAA Inc Balance Sheet 2021 2019 Assets Cash & Equivalents Accounts Receivable Inventory Total Current Assets Prop, Plant & Equip - Net Total Assets For Year Ended Dec 31st, 2020 $150,450 $102,750 2,635,300 2,200,700 827,500 787,800 3,613,250 3,091,250 5,893,670 5,287,550 $9,506,920 $8,378,800 $85,650 1,800,400 675,350 2,561,400 4,750,400 $7,311,800 2021 2020 2019 Liabilities & Equity Accounts Payable Accrued Wages Payable Income Tax Payable Short-term Debt Total Current Liabilities $926,750 140,300 250,660 775,800 2,093,510 $787,850 128,640 220,320 818,750 1,955,560 $645,250 112,400 195,500 915,300 1,868,450 no Selling and Administrative Expenses Advertising Expenses Depreciation Earnings before Interest and Taxes Interest Expense Earnings before Taxes Taxes (38%) Net Income 1,230,000 650,000 154,000 4,456,000 208,500 4,247,500 1,614,050 $2,633,450 1,075,000 525,000 122,800 3,052,200 155,500 2,896,700 1,100,746 $1,795,954 950,800 250,000 105,400 2,843,300 132,250 2,711,050 1,030,199 $1,680,851 AAA Inc Balance Sheet For Year Ended Dec 31st, 2021 Assets Cash & Equivalents Accounts Receivable Inventory Total Current Assets Prop, Plant & Equip - Net Total Assets $150,450 2,635,300 827,500 3,613,250 5,893,670 $9,506,920 2020 $102,750 2,200,700 787,800 3,091,250 5,287,550 $8,378,800 2019 $85,650 1,800,400 675,350 2,561,400 4,750,400 $7,311,800 2021 2020 2019 Liabilities & Equity Accounts Payable Accrued Wages Payable Income Tax Payable Short-term Debt Total Current Liabilities Long-term Debt Total Liabilities Common Stock Retained Earnings Total Equity Total Liabilities and Equity $926,750 140,300 250,660 775,800 2,093,510 2,528,700 4,622,210 1,770,000 3,114,710 4,884,710 $9,506,920 $787,850 128,640 220,320 818,750 1,955,560 2,302,400 4,257,960 1,250,000 2,870,840 4,120,840 $8,378,800 $645,250 112,400 195,500 915,300 1,868,450 1,750,400 3,618,850 1,100,000 2,592,950 3,692,950 $7,311,800 Answer the following questions. Please note: short-term investments are non-operating current assets; notes payable and short-term debt are non-operating current liabilities. a) What is the Net Operating Profit after tax (NOPAT) for 2021? b) What is Operating Cash Flow for 2021? c) What is Free Cash Flow for 2021? (Short-term debt is not part of operating net working capital.) d) The stock is traded at $66 per share at the end of 2021 and there are 195,000 shares outstanding. What is MVA during 2021? e) Given the firm's WACC is 10%, what is EVA during 2021? f) Create common size income statement and balance sheet for 2021, 2020 and 2019. g) Create income statement and balance sheet percentage change analysis for 2021 and 2020. (Use 2019 as the base year)


 please solve using excel and show work


