

Question: please some account genius can help me with my paper from my text book material and calculate ratios for coca-cola company i have all the
please some account genius can help me with my paper from my text book material and calculate ratios for coca-cola company i have all the pages pictures posted i know its alot help will be great if somebody knows how to do it.

email your email too if answer if you can answer thank you.
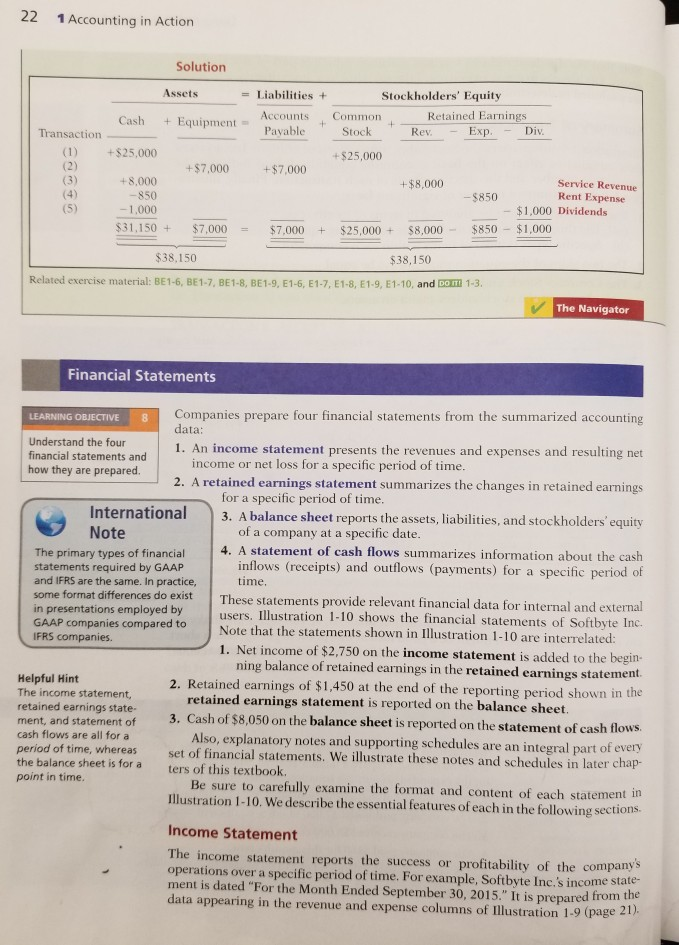
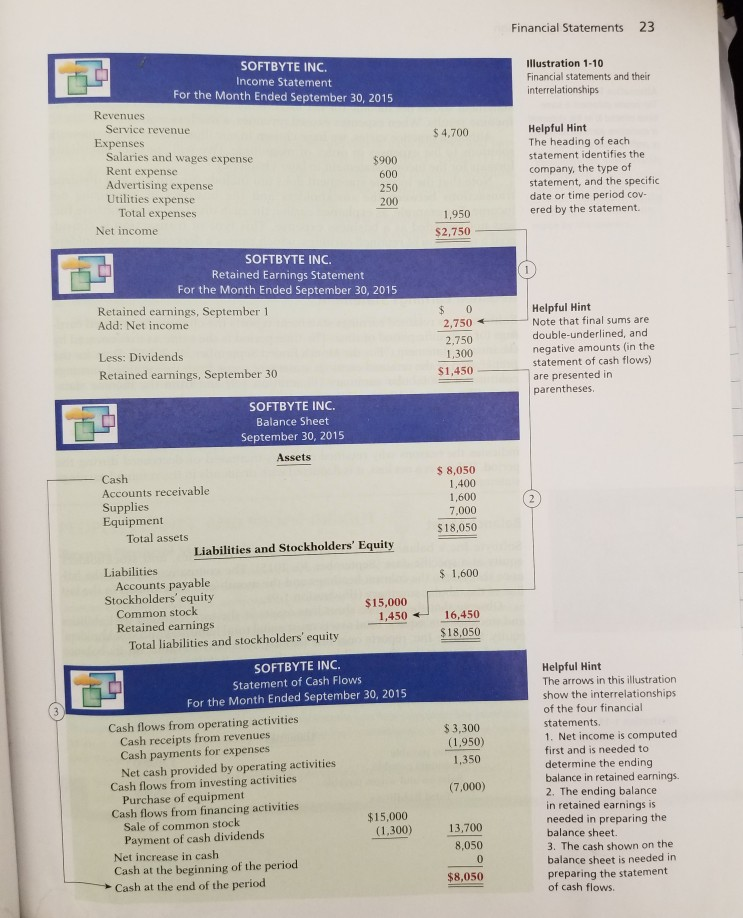
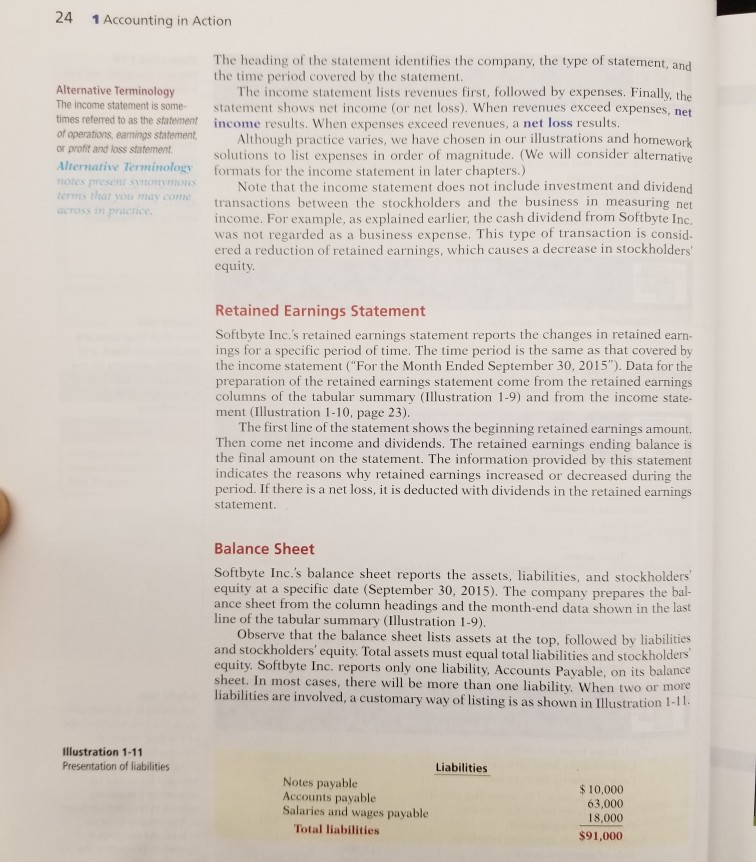
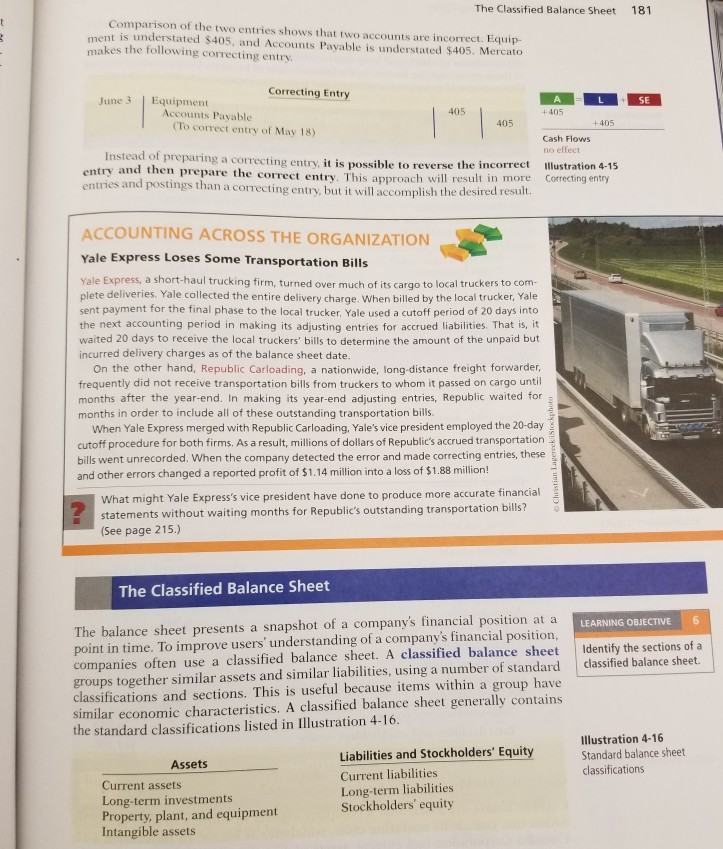
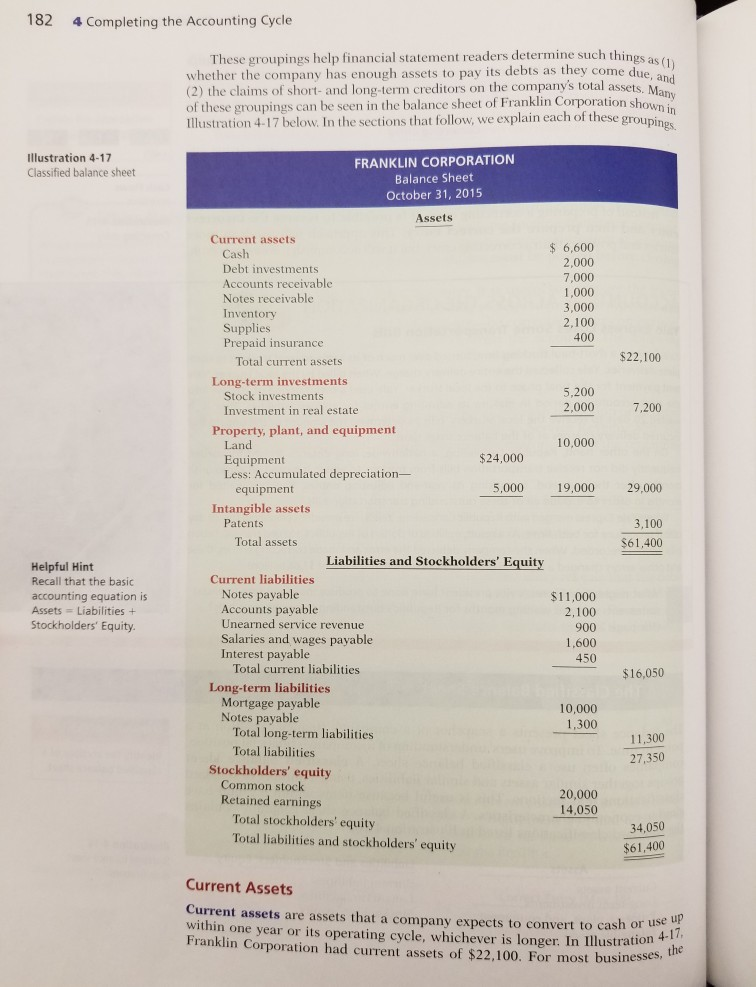
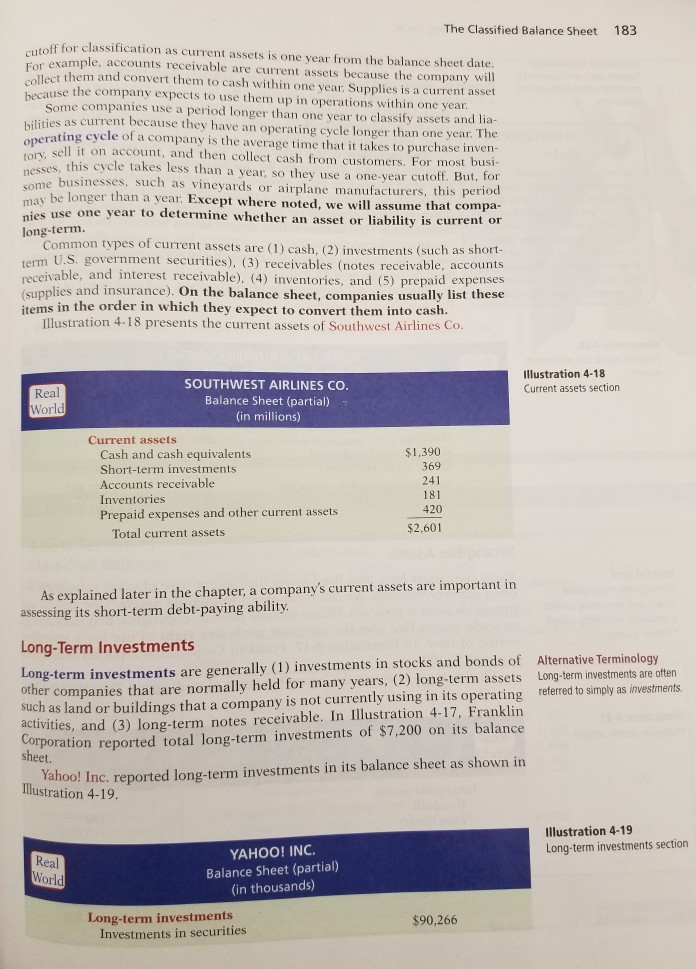
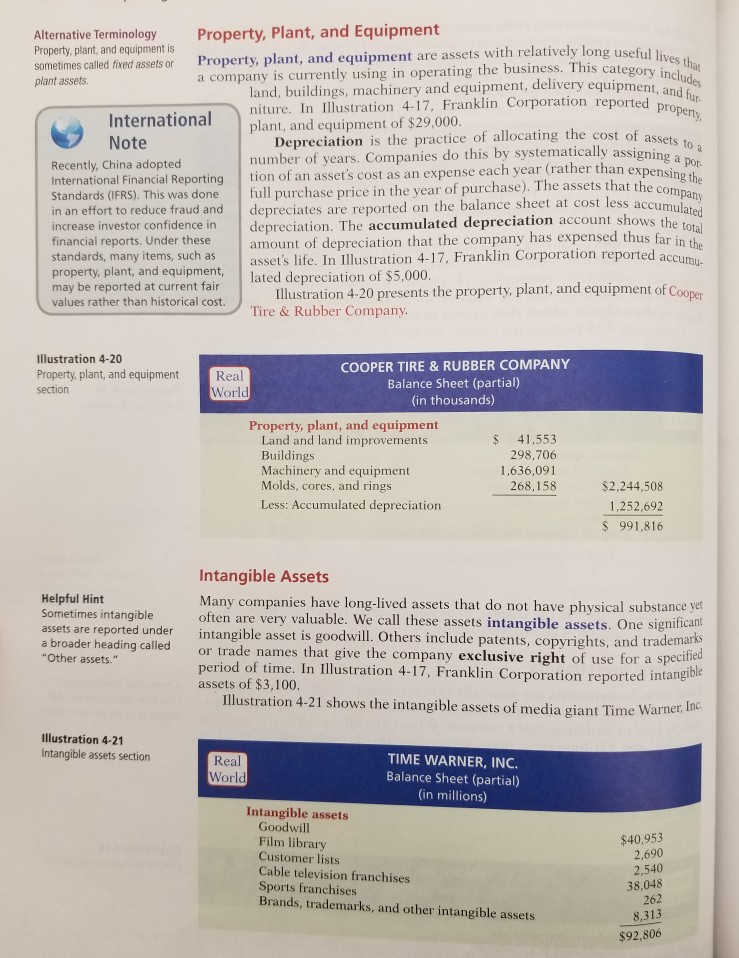
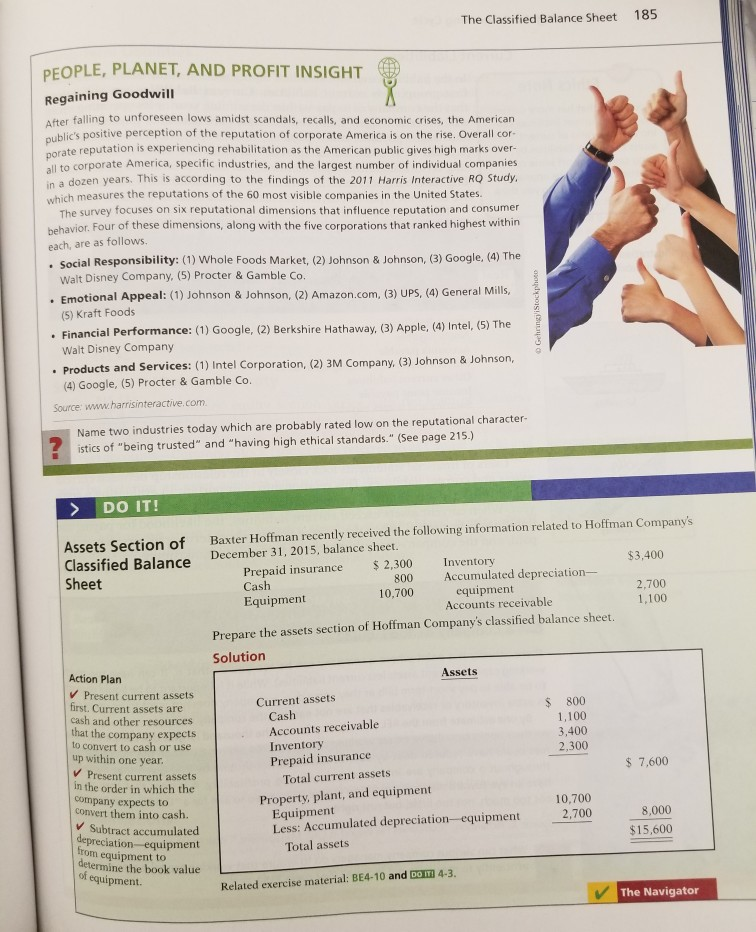
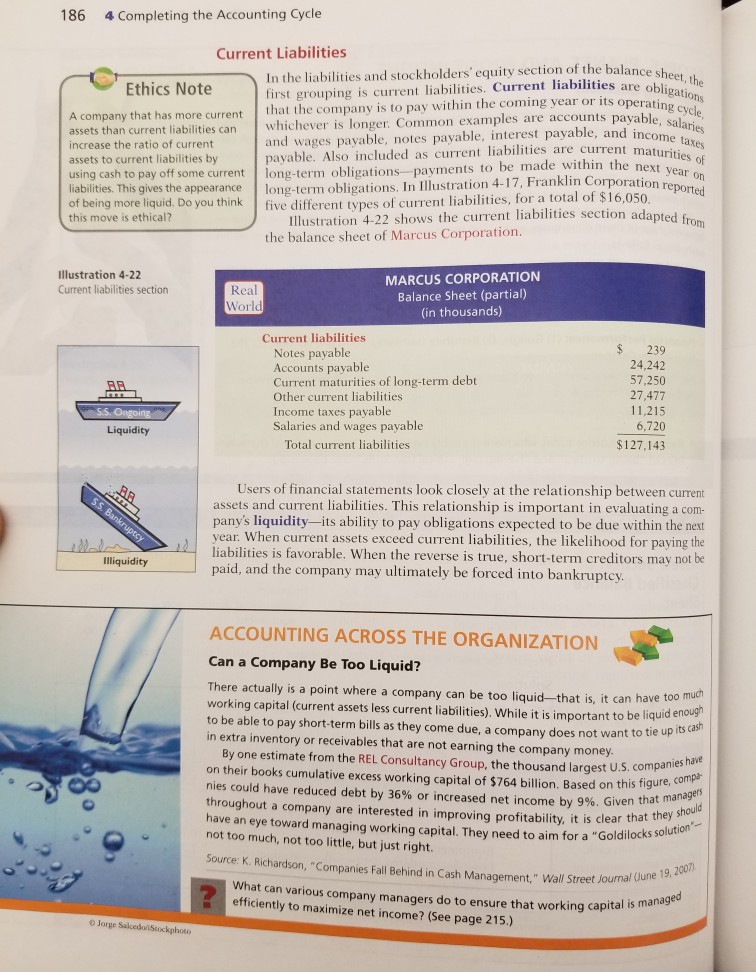
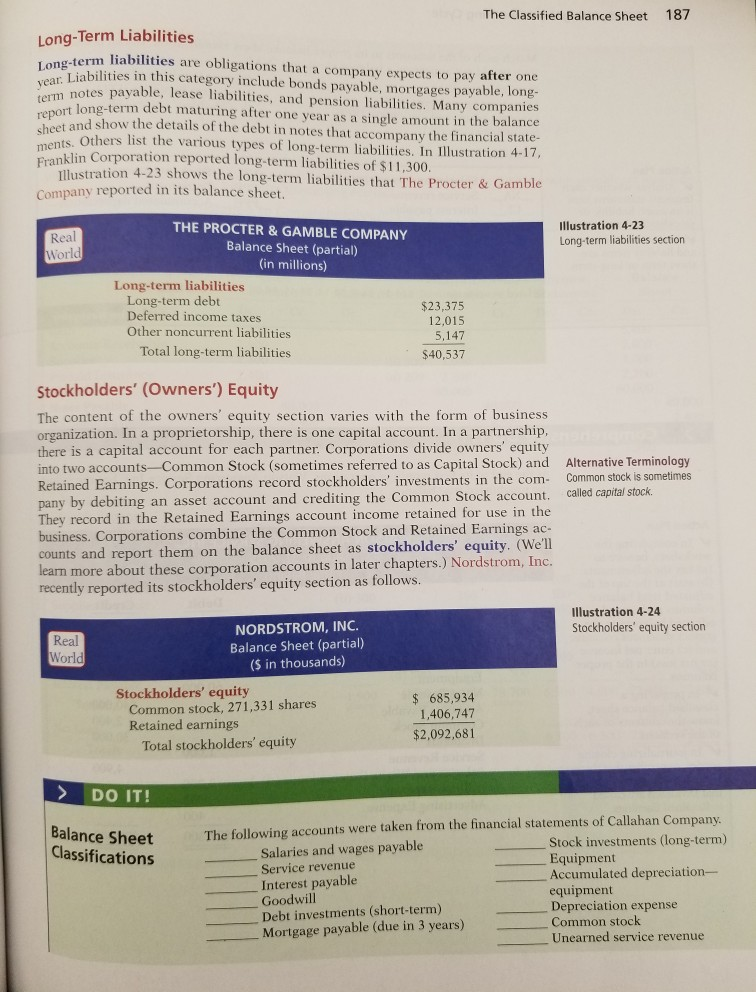
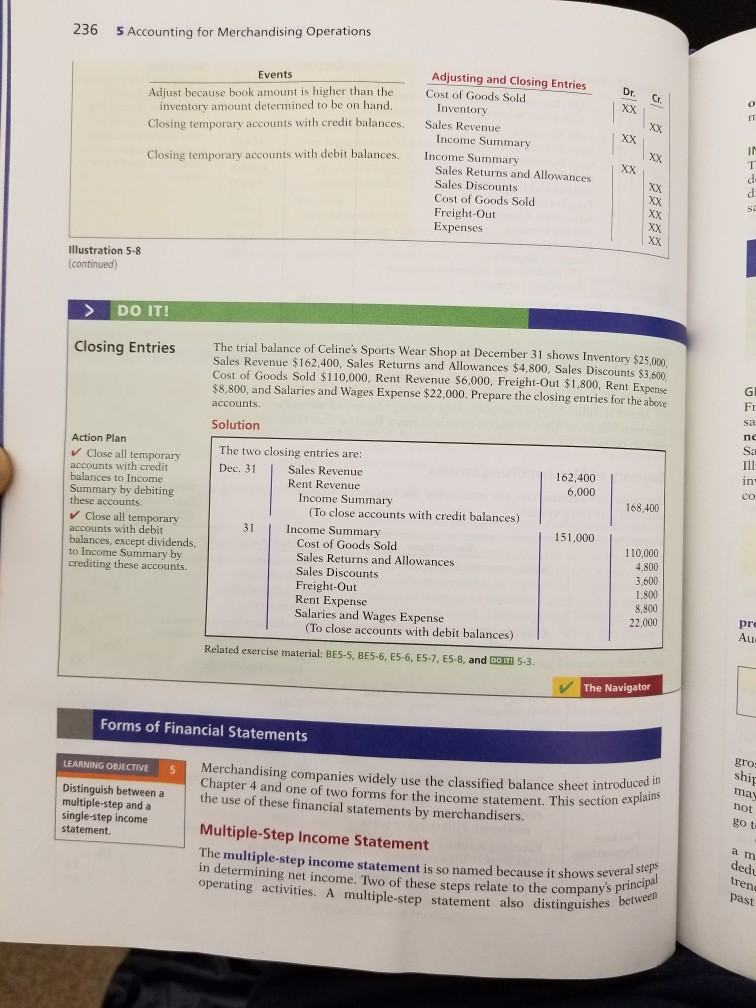
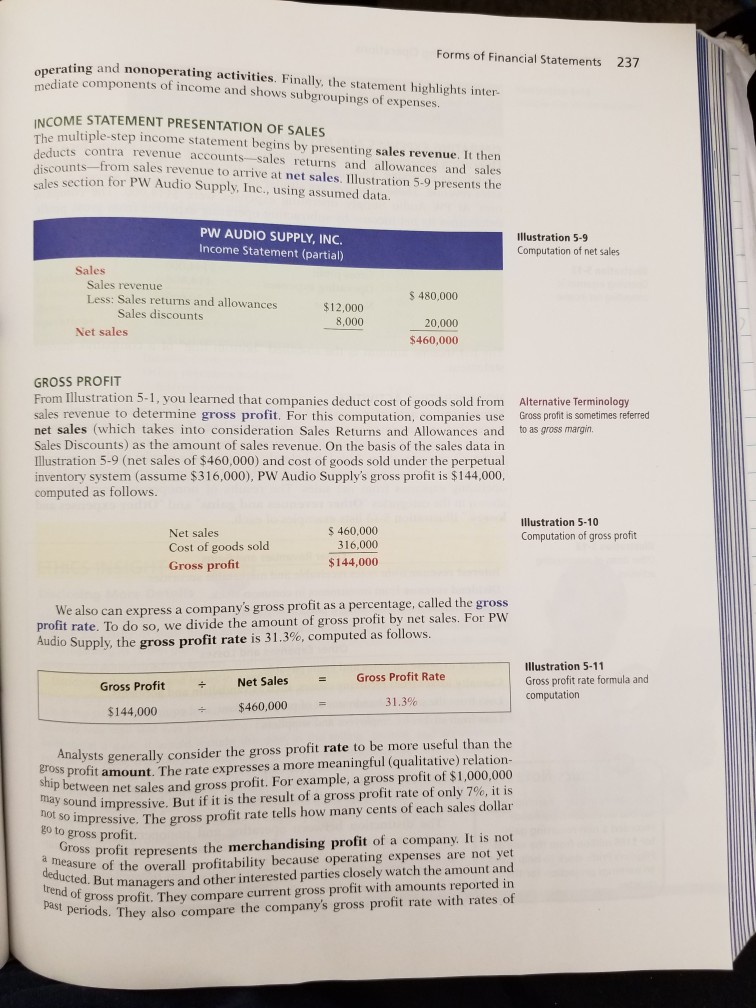
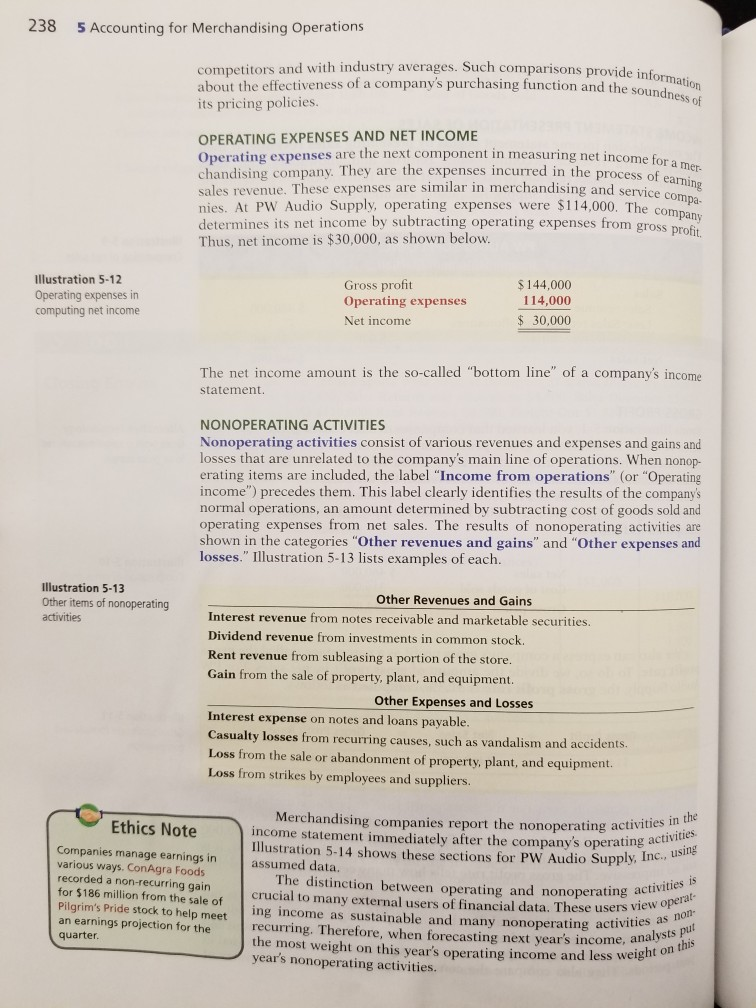
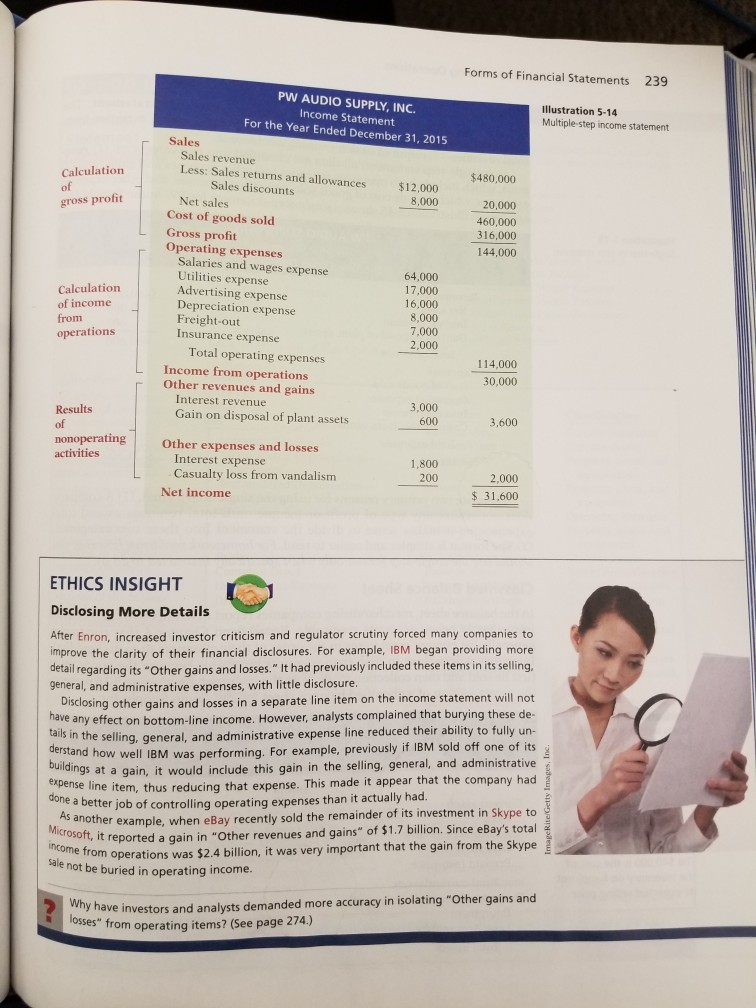
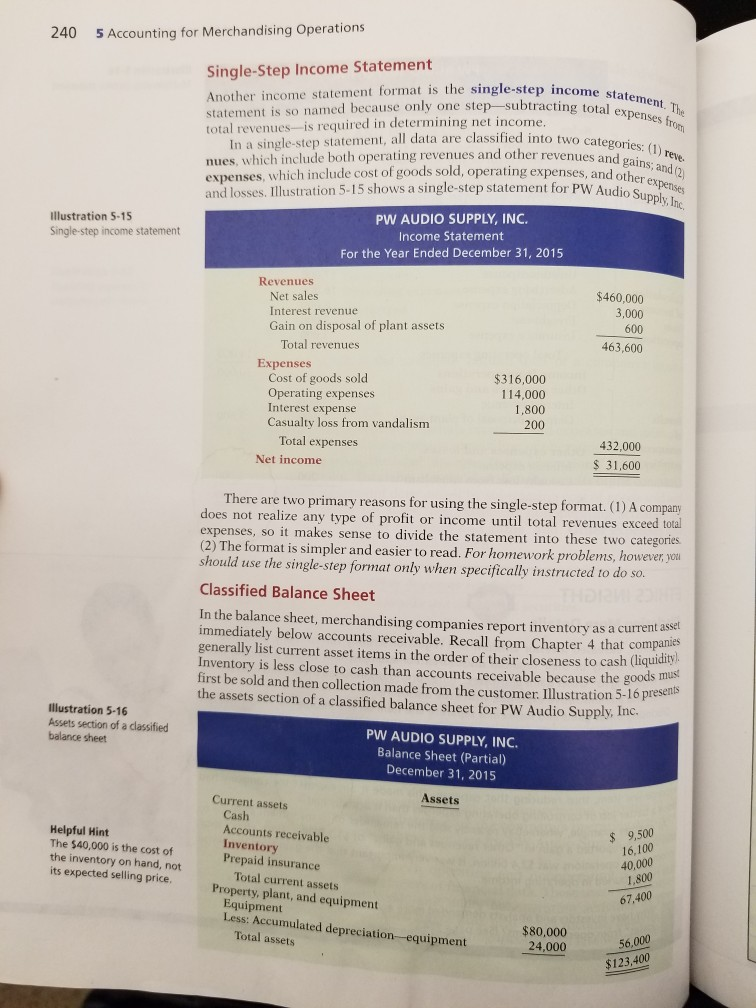
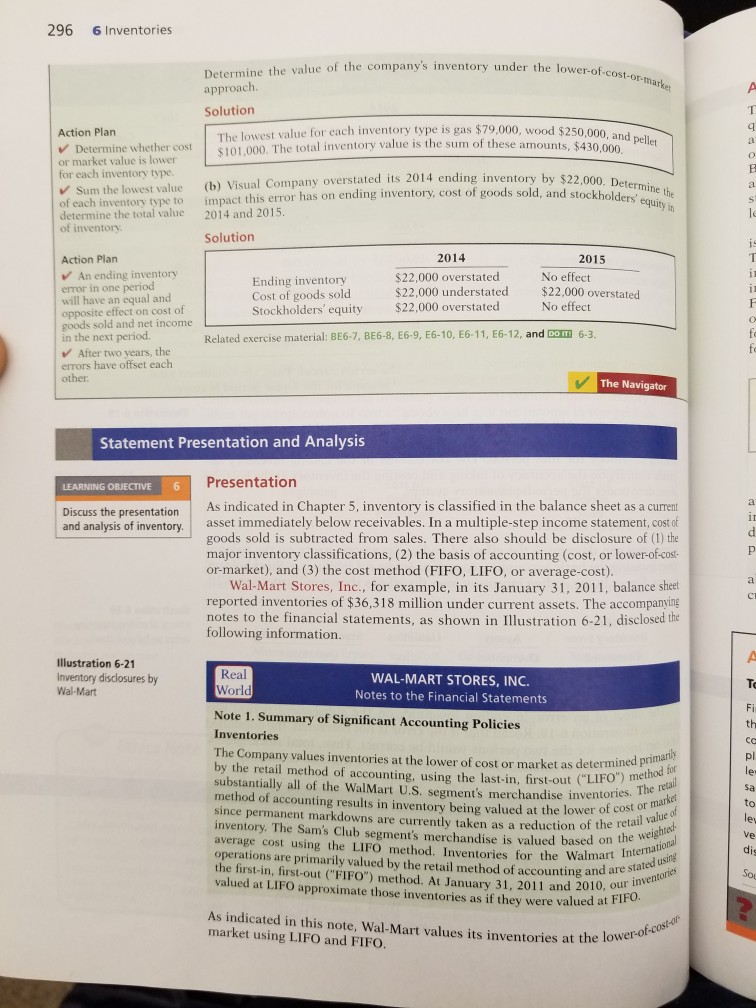
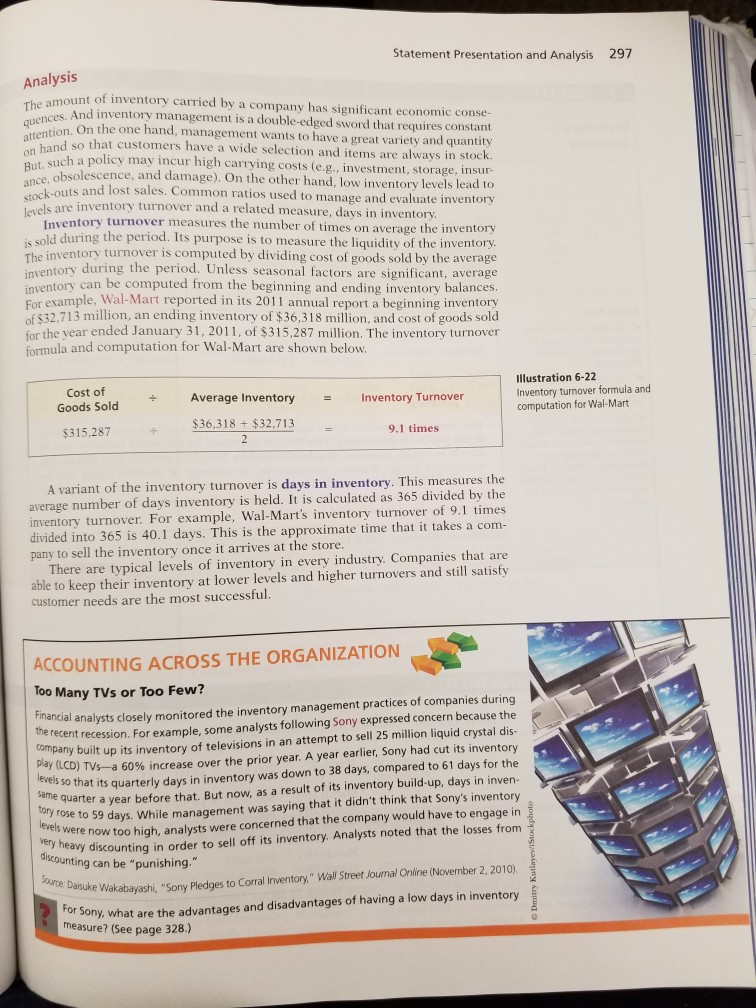
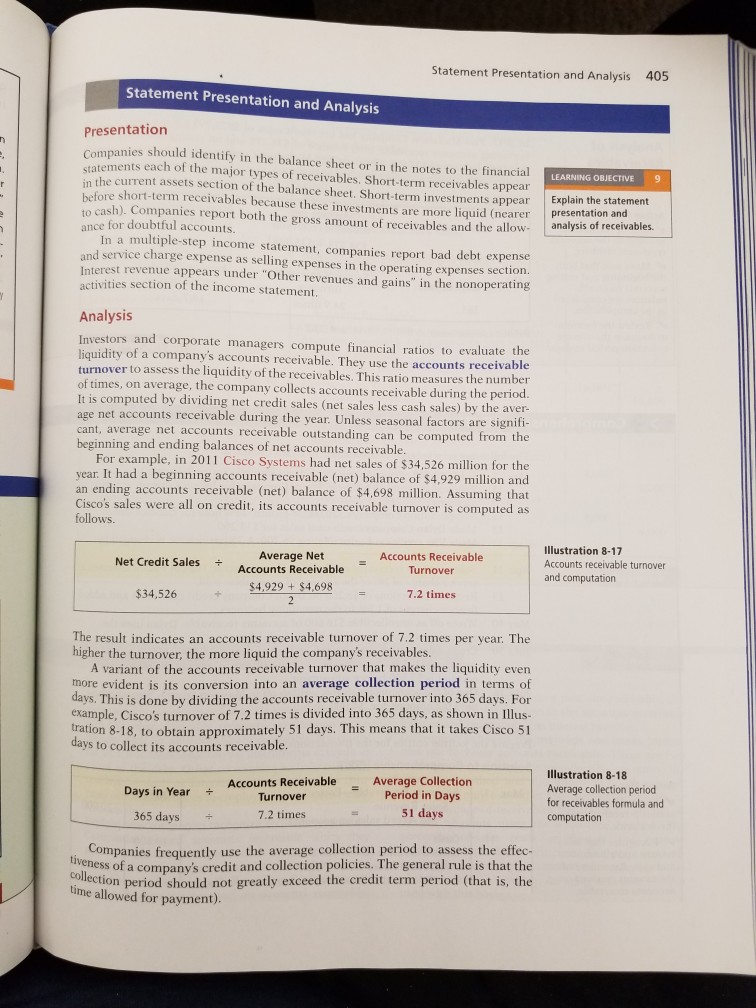
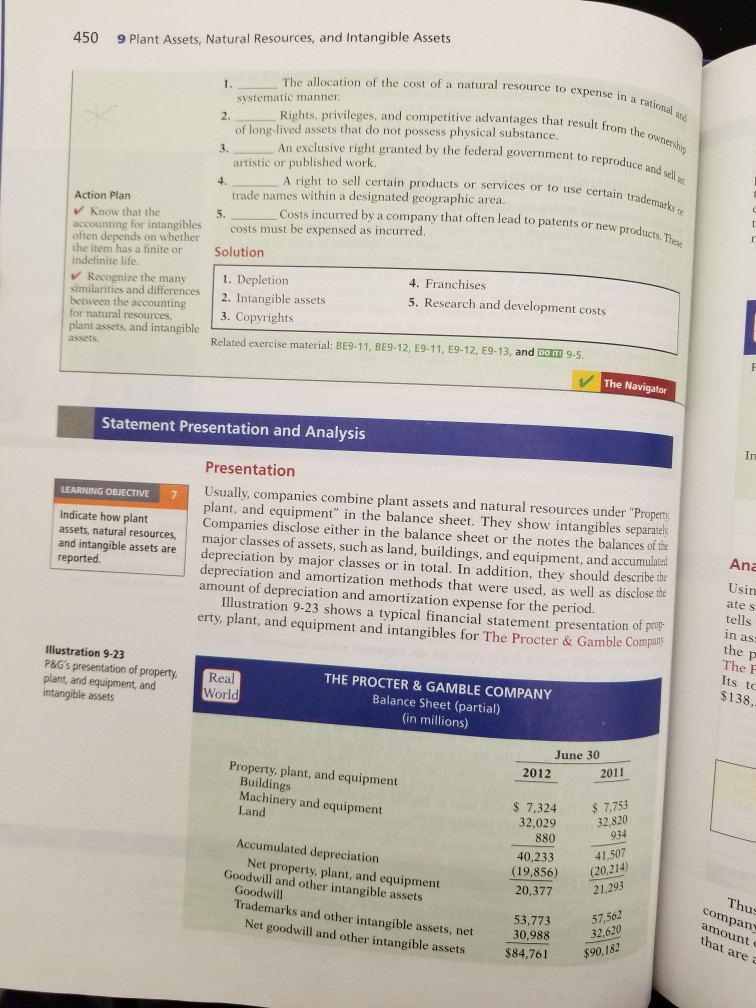
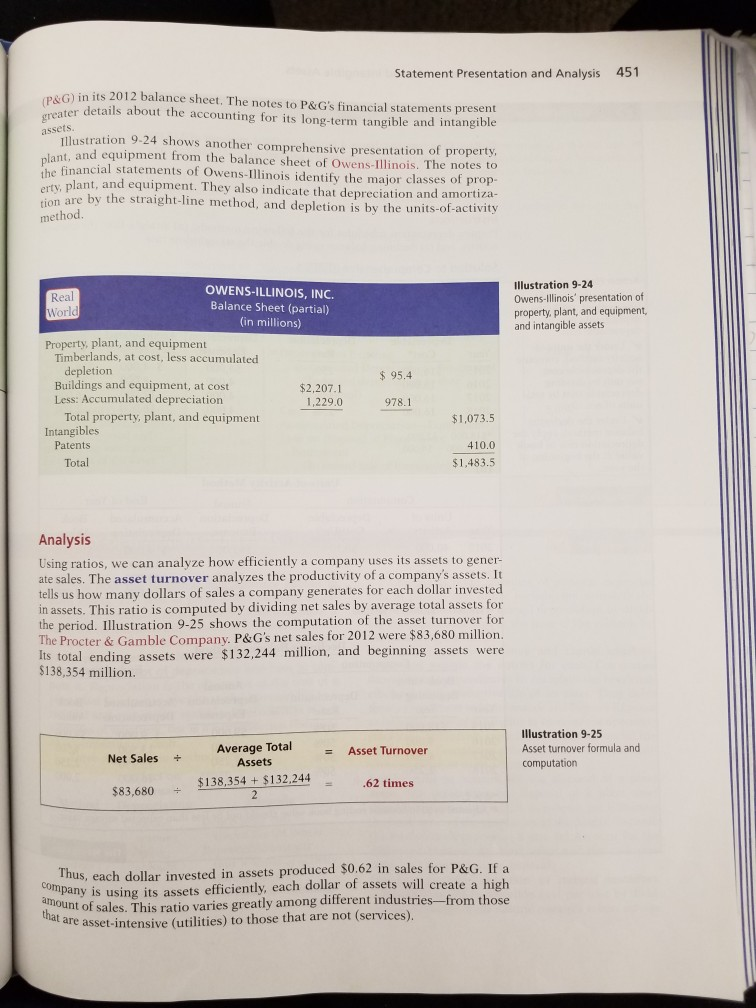
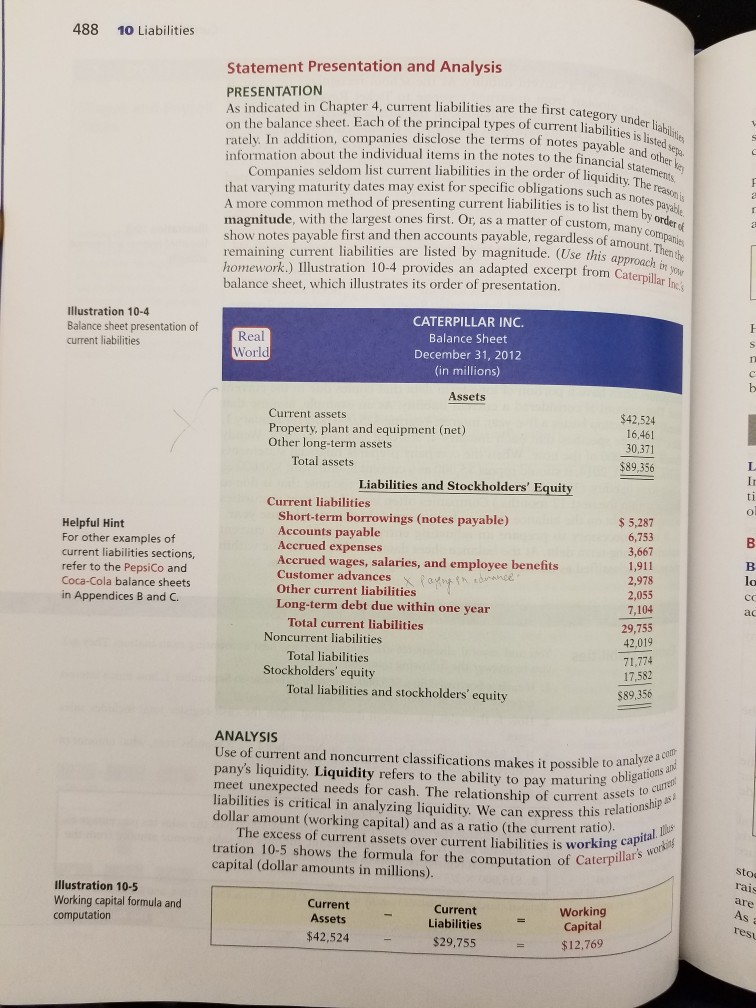
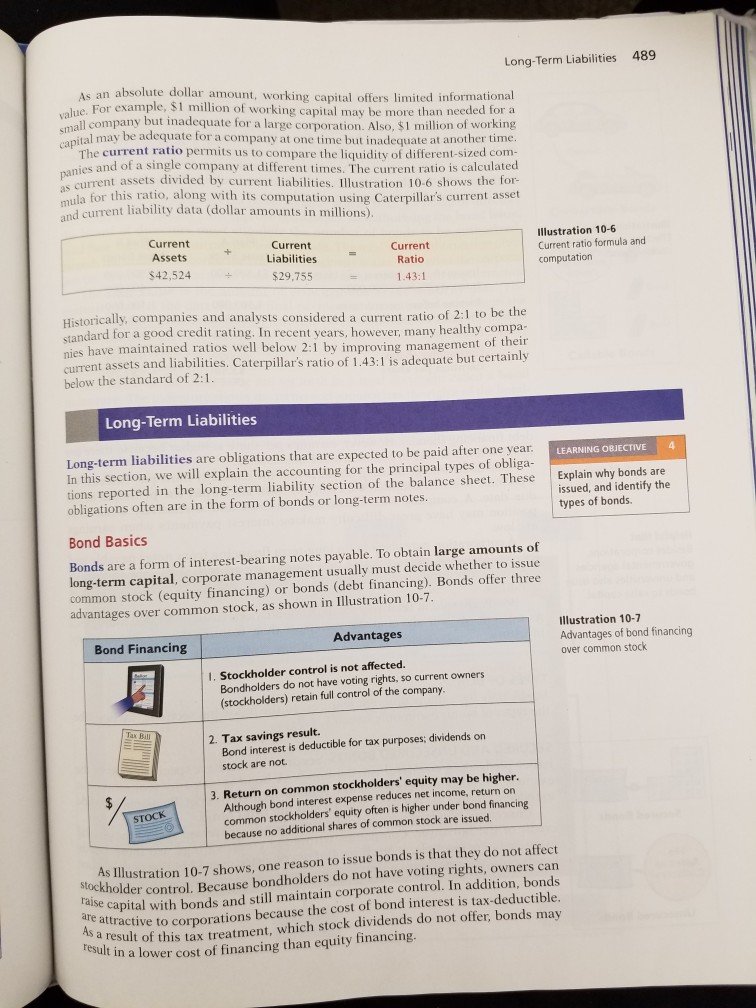
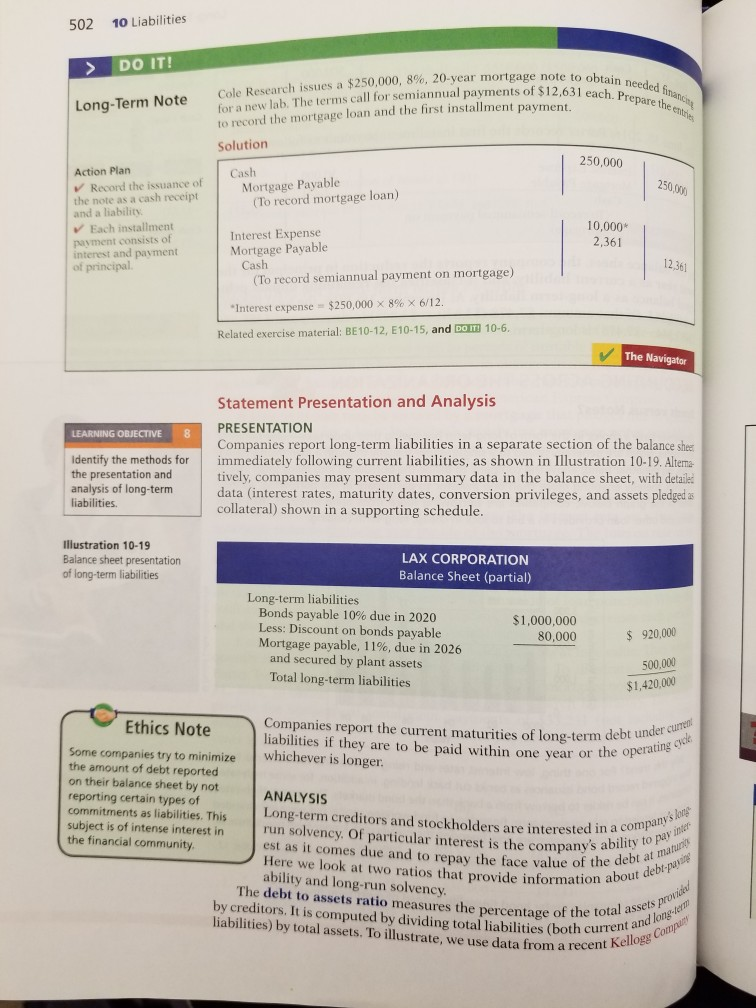
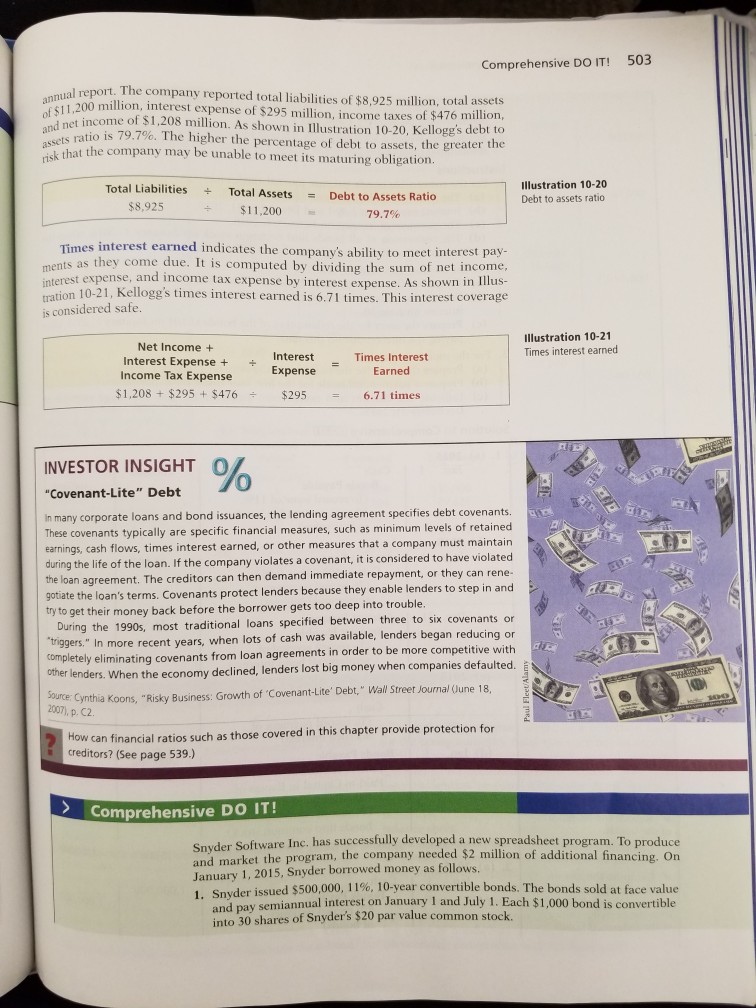
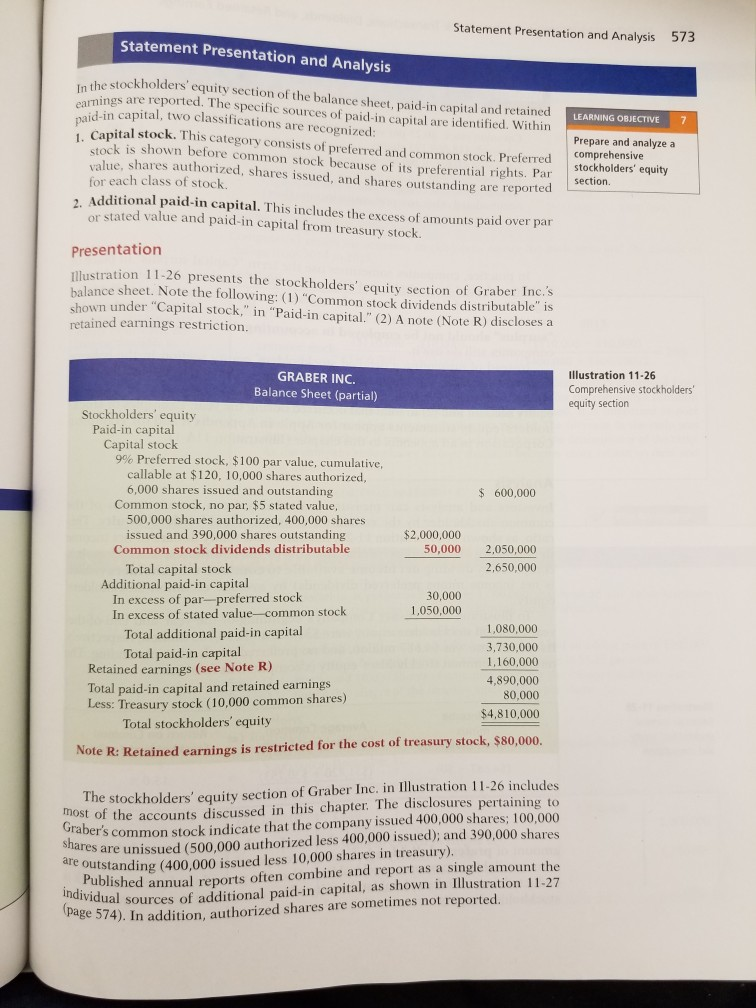
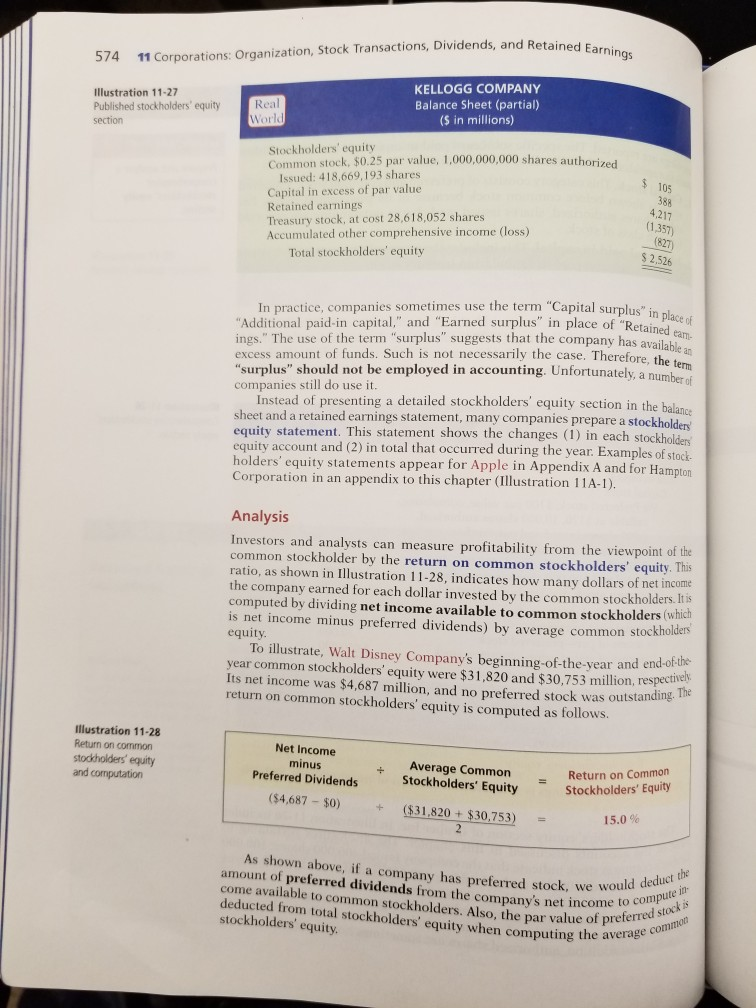
You need the textbook to do this assignment. The main purpose of this assignment is to see the general picture of different events and transactions we covered during this course. You should be able to understand financial statements components 1) Read material from the textbook related to financial statements and ratios: Chl. Financial Statements p 22-25, Ch4. The Classified Balance Sheet p. 181-187. Ch5. Forms of financial statements: p.236-240, Ch.6 Statement Presentation and Analysis: p.296-297 Ch.8 Statement Presentation and Analysis: p.405, Ch.9 Statement Presentation and Analysis: p 450-451, Ch. 10 Statement Presentation and Analysis: p.488-489, p.502-503. p. Ch.11 Statement Presentation and Analysis: p.573-574 2) Calculate ratios for the Coca-Cola company (Appendix C in the textbook) You can find the ratios in the first part of this assignment. There should be 10 ratios. 22 1 Accounting in Action Solution Stockholders' Equity Liabilities + Accounts Common Payable Stock Assets Retained Earnings Cash Equipment Transaction (1) +$25,000 +$25,000 +$7,000 Service Revenue Rent Expense +$8,000 +8,000 850 1,000 $1,000 Dividends 31,150 $7,000$7,000 $25,000$8,000 $850 $1,000 $38,150 Related exercise material: BE1-6, BE1-7, BE1-8, BE1-9, E1-6, E1-7, E1-8, E1-9, E1-10, and bo 1-3. The Navigator Financial Statements Companies prepare four financial statements from the summarized accounting data LEARNING OBJECTIVE 8 Understand the four financial statements and how they are prepared 1. An income statement presents the revenues and expenses and resulting net income or net loss for a specific period of time 2. A retained earnings statement summarizes the changes in retained earnings for a specific period of time 3. A balance sheet reports the assets, liabilities, and stockholders' equity Note of a company at a specific date. The primary types of financial 4. A statement of cash flows summarizes information about the cash statements required by GAAP and IFRS are the same. In practice some format inflows (receipts) and outflows (payments) for a specific period of time These statements provide relevant financial data for internal and exter Note that the statements shown in Illustration 1-10 are interrelated: t differences do exist in presentations employed by users. Illustration 1-10 shows the financial statements GAAP companies compared to IFRS companies. 1. Net income of $2,750 on the income statement is added to the begin- ning balance of retained earnings in the retained earnings statement 2. Retained earnings of $1,450 at the end of the reporting period shown in the Helpful Hint The income statement, retained earnings state- ment, and statement of cash flows are all for a period of time, whereas the balance sheet is for a point in time retained earnings statement is reported on the balance sheet. 3. Cash of $8,050 on the balance sheet is reported on the statement of cash flows Also, explanatory notes and supporting schedules are an integral part of ev set of financial statements. We illustrate these notes and schedules in later chap ters of this textbook. Be sure to carefully examine the format and content of each statement in llustration 1-10. We describe the essential features of each in the following sections. Income Statement The income statement reports the success or profitability of the company operations over a specific period of time. For example, Softbyte Inc.'s income sta ment is dated "For the Month Ended September 30, 2015." It is prepared from the data appearing in the revenue and expense columns of Illustration 1-9 (page 21 Financial Statements 23 SOFTBYTE INC. Income Statement For the Month Ended September 30, 2015 Illustration 1-10 Financial statements and their interrelationships Revenues Service revenue Helpful Hint The heading of each statement identifies the company, the type of statement, and the specific date or time period cov- ered by the statement Expenses Salaries and wages expense Rent expense Advertising expense Utilities expense 600 250 Total expenses Net income $2,750 SOFTBYTE INC. Retained Earnings Statement For the Month Ended September 30, 2015 Retained earnings, September 1 Add: Net income Helpful Hint 2,750Note that final sums are double-underlined, and negative amounts (in the Less: Dividends Retained earnings, September 30 statement of cash flows) $1,450 are presented in parentheses SOFTBYTE INC. Balance Sheet September 30, 2015 Assets $ 8,050 Cash Accounts receivable Supplies Equipment $18,050 Total assets Liabilities and Stockholders' Equity Liabilities S 1,600 Accounts payable Stockholders' equity Common stock Retained earnings $15,000 1,450 $18,050 Total liabilities and stockholders' equity SOFTBYTE INC. Statement of Cash Flows For the Month Ended September 30, 2015 Helpful Hint The arrows in this illustration show the interrelationships of the four financial Cash flows from operating activities Cash receipts from revenues Cash payments for expenses Net cash provided by operating activities $ 3,300 (1.950) 1,350 1. Net income is computed first and is needed to determine the ending balance in retained earnings. 2. The ending balance in retained earnings is needed in preparing the balance sheet. 3. The cash shown on the balance sheet is needed in preparing the statement of cash flows Cash flows from investing activities Purchase of equipment Cash flows from financing activities Sale of common stock Payment of cash dividends $15,000 (1.300) 13.700 8,050 0 $8,050 Net increase in cash Cash at the beginning of the period +Cash at the end of the period 24 1 Accounting in Action The heading of the statement identifies the company, the type of statement, and the time period covered by the statement. Alternative Terminology The income statement is somestatement shows net income (or net loss). When revenues exceed expenses, net times referred to as the statement of operations, earmings statement The income statement lists revenues first, followed by expenses. Finally, the income results. When expenses exceed revenues, a net loss results Although practice varies, we have chosen in our illustrations and homework solutions to list expenses in order of magnitude. (We will consider alternative or profit and loss statement Iternative Terminology notes present snOnymous tenns that you may come across in practice formats for the income statement in later chapters.) Note that the income statement does not include investment and dividend transactions between the stockholders and the business in measuring net ome. For example, as explained earlier, the cash dividend from Softbyte Inc was not regarded as a business expense. This type of transaction is consid- ered a reduction of retained earnings, which causes a decrease in stockholders equity Retained Earnings Statement Softbyte Inc.'s retained earnings statement reports the changes in retained earn ings for a specific period of time. The time period is the same as that covered by the income statement ("For the Month Ended September 30, 2015"). Data for the preparation of the retained earnings statement come from the retained earnings lumns of the tabular summary (Illustration 1-9) and from the income state ment (Illustration 1-10, page 23) The first line of the statement shows the beginning retained earnings amount. Then come net income and dividends. The retained earnings ending balance is the final amount on the statement. The information provided by this statement indicates the reasons why retained earnings increased or decreased during the period. If there is a net loss, it is deducted with dividends in the retained earnings statement Balance Sheet Softbyte Inc.'s balance sheet reports the assets, liabilities, and stockholders equity at a specific date (September 30, 2015). The company prepares the bal- ance sheet from the column headings and the month-end data shown in the l line of the tabular summary (Illustration 1-9) Observe that the balance sheet lists assets at the top, followed by liabilities and stockholders' equity. Total assets must equal total liabilities and stockholders equity. Softbyte Inc. report heet. In most cases, there will be more than one liability. When two or mo liabilities are involved, a customary way of listing is as shown in Illustration 1-11. s only one liability, Accounts Payable, on its b llustration 1-11 Presentation of liabilities Liabilities Notes payable Accounts payable Salaries and wages payable 10,000 63,000 Total liabilities $91,000 Financial Statements 25 The balance sheet is like a snapshot of the company's financial condition at a cific moment in time (usually the month-end or year-end) Statement of Cash Flows The statement of cash flows provides information on the cash receipts and pay ments for a specific period of time. The statement of cash flows reports (1) the cash effects of a company's operations during a period, (2) its investing activities, Helpful Hint 3) its financing activities, (4) the net increase or decrease in cash during the period, Investing activities pertain and (5) the cash amount at the end of the period to investments made by the Reporting the sources, uses, and change in cash is useful because investors, company, not investments creditors, and others want to know what is happening to a company's most liquid made by the owners urce. The statement of cash flows provides answers to the following simple ut important questions. 1. Where did cash come from during the period? 2. What was cash used for during the period? 3. What was the change in the cash balance during the period? As shown in Softbyte Inc.'s statement of cash flows in Illustration 1-10, cash increased $8,050 during the period. Net cash provided by operating activities in- creased cash $1,350. Cash flow from investing activities decreased cash $7.000 while cash flow from financing activities increased cash $13,700. At this time you need not be concerned with how these amounts are determined. Chapter 13 will examine in detail how the statement is prepared. PEOPLE, PLANET, AND PROFIT INSIGHT Planet Beyond Financial Statements 3BL Should we expand our financial statements beyond the income statement, retained statement, balance sheet, and statement of cash flows? Some believe we should take into account ecological and social performance, in addition to financial results, in evaluati company. The argument is that a company's responsibility lies with anyone who is influenced by its actions. In other words, a company should be interested in benefiting many differ parties, instead of only maximizing stockholders' interests. earnings ent A socially responsible business does not exploit or endanger any group of individuals follows fair trade practices, provides safe environments for worker for environmental damage. Granted, measurement of these factors is difficult. Ho s, and bears responsibility w to report nderway we provide additional insights into how companies are attempting nformation is also controversial. But, many interesting and useful efforts are u s i hroughout this textbook, meet the challenge of measuring and reporting their contributions to society their financial results, to stockholders. Why might a company's stockholders be interested in its environmental and social performance? (See page 49.) The Classified Balance Sheet 181 Comparison of the two entries shows that two accounts are incorrect. Equip- ment is understated $405, and Accounts Payable is understated $405. Mercato makes the following correcting entry. Correcting Entr June 3 Equipment SE Accounts Payable 405 +405 405 +405 To correct entry of May 18) Cash Flows no effect Instead of preparing a co entry and then prepare the rrecting entry, it is possible to reverse the incorrect Illustration 4-15 ecorect entry. This approach will result in more Correcting entry Thi tries and postings th an a correcting entry, but it will accomplish the desired result. en ACCOUNTING ACROSS THE ORGANIZATION Yale Express Loses Some Transportation Bills Yale Ex plete deliveries. Yale collected the entire delivery charge. When billed by the local trucker, Yale sent payment for the final phase to the local trucker. Yale used a cutoff period of 20 days into the next accounting period in making its adjusting entries for accrued liabilities. That is, it waited 20 days to receive the local truckers' bills to determine the amount of the unpaid but incurred delivery charges as of the balance sheet date. s, a short-haul trucking firm, turned over much of its cargo t o local truckers to com On the other hand, Republic Carloading, a nationwide, long-distance freight forwarder frequently did not receive transportation bills from truckers to whom it passed on cargo until months after the year-end. In making its year-end adjusting entries, Republic waited for months in order to include all of these outstanding transportation bills When Yale Express merged with Republic Carloading, Yale's vice president employed the 20-day cutoff procedure for both firms. As a result, millions of dollars of Republic's accrued transportation bills went unrecorded. When the company detected the error and made correcting entries, these and other errors changed a reported profit of $1.14 million into a loss of $1.88 million! What might Yale Express's vice president have done to produce more accurate financial statements without waiting months for Republic's outstanding transportation bills? (See page 215.) The Classified Balance Sheet The balance sheet presents a snapshot of a company's financial position at a point in time. To improve users' understanding of a company's financial position, companies often use a classified balance sheet. A classified balance sheet Identify the sections of a groups together similar assets and similar liabilities, using a number of standard classified balance sheet. classifications and sections. This is useful because items within a group have imilar economic characteristics. A classified balance sheet generally contains the standard classifications listed in Illustration 4-16 LEARNING OBJECTIVE 6 Illustration 4-16 Standard balance sheet classifications Liabilities and Stockholders' Equity Current liabilities Long-term liabilities Stockholders' equity Assets Current assets Long-term investments Property, plant, and equipment Intangible assets 182 4 Completing the Accounting Cycle These groupings help financial statement readers determine such things as ( whether the company has enough assets to pay its debts as they come due (2) the claims of short- and long-term creditors on the company's total assets. Man of these groupings can be seen in the balance sheet of Franklin Corporation showhy Illustration 4-17 below. In the sections that follow, we explain each of these groupings Illustration 4-17 Classified balance sheet FRANKLIN CORPORATION Balance Sheet October 31, 2015 Assets Current assets Cash Debt investments Accounts receivable Notes receivable Inventory Supplies Prepaid insurance 6,600 2,000 7,000 1,000 3,000 2,100 400 Total current assets $22,100 Long-term investments Stock investments Investment in real estate 5,200 2,000 7,200 Property, plant, and equipment 10,000 Land Equipment Less: Accumulated depreciation- $24,000 5,000 19,000 29,000 quipment Intangible assets 3,100 S61,400 Patents Total assets Liabilities and Stockholders' Equit Helpful Hint Recall that the basic accounting equation is Assets Liabilities+ Stockholders Equity. Current liabilities Notes payable Accounts payable Unearned service revenue Salaries and wages payable Interest payable $11,000 2,100 900 600 450 Total current liabilities $16,050 Long-term liabilities Mortgage payable Notes payable 10,000 Total long-term liabilities 1.300 1.300 Total liabilities Stockholders' equity Retained earnings 27,350 Common stock 20,000 14,050 Total stockholders' equity Total liabilities and stockholders' equity 34,050 $61,400 Current Assets Current assets are assets that a company expects to convert to cash or u within one year or its operating cycle, whichever is longer. In Illustratio Franklin Corporation had current assets of $22,100. For most businesses the The Classified Balance Sheet 183 utoff for classification as current assets is one year from the balance sheet date example, accounts receivable are current assets because the company will lect them and convert them to cash within one year. Supplies is a current asset ctl co because the company expects to use them up in operations within one year Some companies use a period longer than one year to classify assets and la- bilities as current because they have an operating cycle longer than one year. The ting cycle of a company is the average time that it takes to purchase inven sell it on account, and then collect cash from customers. For most busi s, this cycle takes less than a year, so they use a one-year cutoff. But, for me businesses, such as vineyards or airplane manufacturers, this pe ma nies use one year to determine whether an asset or liability is current or long-term riod y be longer than a year. Except where noted, we will assume that compa Common types of current assets are (1) cash, (2) nvest men U.S. government securities), (3) receivables (notes receivabl ivable, and interest receivable), (4) inventories, and (5) prepaid ex ts (such as short (supplies and insurance). On the balance sheet, companies usually list these items in the order in which they expect to convert them into cash. llustration 4-18 presents the current assets of Southwest Airlines Co SOUTHWEST AIRLINES co Balance Sheet (partial) Illustration 4-18 Current assets section Real Current assets $1,390 Cash and cash equivalents Short-term investments Accounts receivable Inventories Prepaid expenses and other current assets 241 181 420 Total current assets $2,601 As assessing its short-term debt-paying ability. Long-Term Investments Long-term investments are generally (1) investments in stocks and bonds of explained later in the chapter, a company's current assets are important in Alternative Terminology as land or buildings that a company is not currently using in its operating referred to simply as investments vities, and (3) long-term notes receivable. In Illustration 4-17, Franklin poration reported total long-term investments of $7,200 on its balance er companies that are normally held for many years, (2) long-term assets Long-term investments are often et. Yahoo! Inc. reported long-term investments in its balance sheet as shown in Ilustration 4-19 Illustration 4-19 Long-term investments section YAHOO! INC. Real rl Balance Sheet (partial) (in thousands) Long-term investments $90,266 Investments in securities Property, Plant, and Equipment Alternative Property, plant, and equipment is sometimes called fixed assets or plant assets. Terminology Property, plant, and equipment are assets with relatively long a company is currently using in operating the business. This catego land, buildings, machinery and equipment, delivery equipmen niture. In Illustration 4-17, Franklin Corporation reported po plant, and equipment of $29,000 International Depreciation is the practice of allocating the cost of as number of years. Companies do this by systematically assig assets to a Note Recently, China adopted International Financial Reporting tion of an asset's cost a Standards (IFRS). Thi in an effort to reduce fraud and depreciates are reported on the balance sheet at cost less accumulated increase investor confidence in depreciation. The accumulated deprecia financial reports. Under these standards, many items, such as asset's life. In Illustration 4-17, Franklin Corporation reported accumu property, plant, and equipment may be reported at currentfailated depreciation of $5,000 in tional Financial Reporting tion of an asset's cost as an expense each year (rather than ex g t pany the co full purchase price in the year of purchase). The assets that The accumulated depreciation account shows the us far total amount of depreciation that the company has expensed th Illustration 4-20 presents the property, plant, and equipment of Cooper Tire & Rubber Company values rather than historical cost. Illustration 4-20 Property, plant, and equipment section COOPER TIRE & RUBBER COMPANY Balance Sheet (partial) (in thousands) Rea Property, plant, and equipment S 41,553 298,706 1,636,091 268,158 Land and land improvements Machinery and equipment Molds, cores, and rings Less: Accumulated depreciatiorn $2,244,508 1,252,692 S 991,816 Intangible Assets Many companies have long-lived assets that do not have physical substance yet often are very valuable. We call these assets intangible assets. One significant or trade names that give the company exclusive right of use f eriod of time. In Illustration 4-17, Franklin Corporation reported intang assets of $3,100 Helpful Hint Sometimes intangible a broader heading called "Other assets." assets are reported under intangible asset is goodwill. Others include patents, copyrights, and trademarks ibl Illustration 4-21 shows the intangible assets of media giant Time Warner, Illustration 4-21 intangible assets section TIME WARNER, INC. Balance Sheet (partial) (in millions ea Intangible assets Goodwill Film library Customer lists Cable television franchises Sports franchises Brands, trademarks, and other intangible assets $40,953 38,048 26 $92,806 The Classified Balance Sheet 185 PEOPLE, PLANET, AND PROFIT INSIGHT After falling to unforeseen lows amidst scandals, recalls, and economic crises, the American public's positive perception of the reputation of corporate America is on the rise. Overall con orate reputation is experiencing rehabilitation as the American public gives high marks over all to corporate America specific industries, and the largest number of individual companies a dozen years. This is according to the findings of the 2011 Harris Interactive RO Study which measures the reputations of the 60 most visible companies in the United States The survey focuses on six reputational dimensions that influence reputation and consumer behavior. Four of these dimensions, along with the five corporations that ranked highest within each, are as follows . Social Responsibility: (1) Whole Foods Market, (2) Johnson & Johnson, (3) Google, (4) The . Emotional Appeal: (1) Johnson & Johnson, (2) Amazon.com, (3) UPs, (4) General Mill, .Financial Performance: (1) Google, (2) Berkshire Hathaway, (3) Apple, (4) Intel, (5) The . Products and Services: (1) Intel Corporation, (2) 3M Company, (3) Johnson & Johnson Source: www.harrisinteractive.com Walt Disney Company, (5) Procter & Gamble Co (5) Kraft Foods Walt Disney Company (4) Google, (5) Procter & Gamble Co Name two industries today which are probably rated low on the reputational character istics of "being trusted" and "having high ethical standards." (See page 215.) DO IT! Assets Section Classified Balance of Baxter Hoffman recently received the following information related to Hoffman Companys December 31, 2015, balance sheet. $3,400 Prepaid insurance 2,300 Inventory Sheet 800 Accumulated depreciation- Equipment Prepare the assets section of Hoffman Company's classified balance sheet. Solution Action Plan Assets V Present current assets first. Current assets are cash and other resources that the company expects to convert to cash or use up within one year V Present current assets in the order in which the Current assets Accounts receivable Inventory Prepaid insurance Total current assets Property, plant, and equipment 10,700 convert them into cash. Equipment Less: Accumulated depreciation- equipment V Subtract accumulated depreciation-equipment rom equipment to determine the book value 15,600 Total assets Related exercise material: BE4-10 and Do IT1 4-3 The Navigator 236 5 Accounting for Merchandising Operations Adjusting and Closing Entries Dr Inventory Income Summary Adjust because book amount is higher than the Cost of Goods Sold inventory amount determined to be on hand. Closing temporary accounts with credit balances. Sales Revenue xX Closing temporary accounts with debit balances. Income Summa Sales Returns and Allowances Sales Discounts Cost of Goods Sold Freight-Out Expenses Illustration 5-8 (continued) DO IT! The trial balance of Celine's Sports Wear Shop at December 31 shows Inventory $25,000 Sales Revenue $162,400, Sales Returns and Allowances $4,800, Sales Discounts $3.600 Cost of Goods Sold $110,000, Rent Revenue $6,000, Freight-Out $1,800, Rent Expenso $8,800, and Salaries and Wages Expense $22,000. Prepare the closing entries for the above accounts GI Fr Solution ne Action Plan The two closing entries are: Dec. 31 Sales Revenue Rent Revenue Close all temporary accounts with credit balances to Income Summary by debiting these accounts. 162,400 6,000 in co Income Summary 168,400 (To close accounts with credit balances) Close all temporary accounts with debit balances, except dividends, to Income Summary by crediting these accounts. 31 Income Summary 151,000 Cost of Goods Sold Sales Returns and Allowances Sales Discounts Freight-Out Rent Expense Salaries and Wages Expense 110,000 4,800 3.600 8,800 22,000 pre (To close accounts with debit balances) Related exercise material: BES-5, BE5-6, E5-6, E5-7, E5-8, and DOITI 5-3 The Navigator Forms of Financial Statements gro shi Merchandising companies widely use the classified balance sheet int Chapter 4 and one of two forms for the income statement. This section exp LEARNING OBJECTIVE 5 oduced in between athe use of these financial statements by merchandisers multiple-step and a single-step income Multiple-Step Income Statement statement. The multiple-step income statement is so named because it shows severah siol in determining net income. Two of these steps relate to the companys between operating activities. A multiple-step statement also distinguishes st 238 5 Accounting for Merchandising Operations competitors and with industry averages. Such comparisons provide inform about the effectiveness of a company's purchasing function and the its pricing policies OPERATING EXPENSES AND NET INCOME Operating expenses are the next component in measuring net income for company. They are the expenses incurred in the process of ear s revenue. These expenses are similar in merchandising and service nies. At PW Audio Supply, operating expenses were S114,000. The comman determines its net income by subtracting operating expenses from gross nr Thus, net income is $30,000, as shown below pa- Illustration 5-12 Operating expenses in computing net income Gross profit Operating expenses Net income 144,000 114,000 30,000 The net income amount is the so-called "bottom line" of a company's income statement. NONOPERATING ACTIVITIES Nonoperating activities consist of various revenues and expenses and gains and losses that are unrelated to the company's main line of operations. When nonop- erating items are included, the label "Income from operations" (or "Operating income") precedes them. This label clearly identifies the results of the company's normal operations, an amount determined by subtracting cost of goods sold and operating expenses from net sales. The results of nonoperating atvies are shown in the categories "Other revenues and gains" and "Other expenses and losses." Illustration 5-13 lists examples of each Illustration 5-13 Other items of nonoperating activities Other Revenues and Gains Interest revenue from notes receivable and marketable securities Dividend revenue from investments in common stock. Rent revenue from subleasing a portion of the store Gain from the sale of property, plant, and equipment Other Expenses and Losses Interest expense on notes and loans payable Casualty losses from recurring causes, such as vandalism and accident Loss from the sale or abandonment of property, plant, and equipment. Loss from strikes by employees and suppliers. Merchandising companies report the nonoperating ities income statement immediately after the company's operating a Illustration 5-14 shows these sections for PW Audio Supply assumed data. Ethics Note activities in the Companies manage earnings in various ways. ConAgra Foods recorded a non-recurring gain for $186 million from the sale of ing income as sustainable Lus The distinction between operating and nonoperating ac crucial to many external users of financial data. These users inon recurring. Therefore, when forecasting next year's income, analys this the most weight on this year's operating income and less weig rim's Pride stock to help meet and many nonoperating activitess pul an earnings projection for the quarter year's nonoperating activities Forms of Financial Statements 239 PW AUDIO SUPPLY, INC. ncome Statement For the Year Ended December 31, 2015 Illustration 5-14 Multiple-step income statement Sales Sales revenue Less: Sales returns and allowances Calculation of gross profit $480,000 Sales discounts $12,000 8,000 Cost of goods sold Gross profit Operating expenses 20,000 460,000 316,000 144,000 Salaries and wages expense Utilities expense Advertising expense Depreciation expense Freight-out Insurance expense 64,000 17,000 16,000 8,000 7,000 2,000 Calculation of income tions opera Total operating expenses Income from operations Other revenues and gains 114,000 30,000 Interest revenue Gain on disposal of plant assets 3,000 600 Results of nonoperating activities 3,600 Other expenses and losses Interest expense Casualty loss from vandalism 1,800 2,000 $ 31,600 Net income ETHICS INSIGHT Disclosing More Details After Enron, increased investor criticism and regulator scrutiny forced many companies to improve the clarity of their financial disclosures. For example, IBM began providing more detail regarding its "Other gains and losses." It had previously included these items in its selling, Dilosing other gains and losses in a separate line item on the income statement will not have any effect on bottom-line income. However, analysts complained that burying these de- general, and administrative expenses, with little disclosure des in the selling, general, and administrative expense line reduced their ability to fully un- how well IBM was performing. For example, previously if IBM sold off one of its t a gain, it would include this gain in the selling, general, and administrative ense line item, thus reducing that expense. This made it appear that the company had ther example, when eBay recently sold the remainder of its investment in Skype to it reported a gain in "Other revenues and gains" of $1.7 billion. Since eBay's total etter job of controlling operating expenses than it actually had. As sale ne from operations was $2.4 billion, it was very important that the gain from the Skype not be buried in operating income e investors and analysts demanded more accuracy in isolating "Other gains and from operating items? (See page 274.) 240 5 Accounting for Merchandising Operations Single-Step Income Statement Another income statement format is the single-step income stat statement is so named because only one step -subtracting total e total revenues-is required in determining net income The In a single-step statement, all data are classified into tv nues, which include both operating revenues and other revenues and expenses, which include cost of goods sold, operating expenses, and othens, and and losses. Illustration 5-15 shows a single-step statement for PW Audio Spese two categories: (1) reve ains y,Inc. Illustration 5-15 Single-step income statement PW AUDIO SUPPLY, INC. Income Statement For the Year Ended December 31, 2015 Revenues Net sales Interest revenue Gain on disposal of plant assets $460,000 3,000 600 463,600 Total revenues Expenses Cost of goods sold Operating expenses Interest expense Casualty loss from vandalism $316,000 114,000 1,800 200 432,000 Total expenses 31,600 Net income There are two primary reasons for using the single-step format. (1) A company s not realize any type of profit or income until total revenues exceed total penses, so it makes sense to divide the statement into these two categories (2) The format is simpler and easier to read. For homework problems, however you should use the single-step format only when specifically instructed to do so. Classified Balance Sheet In the balance sheet, merchandising companies report inventory as a current asset immediately below accounts receivable. Recall from Chapter 4 that companies generally list current asset items in the order of their closeness to cash (liq Inventory is less close to cash than accounts receivable because the goods first be sold and then collection made from the customer Illustration 5-16 preselis the assets section of a classified balance sheet for PW Audio Supply, Inc, Illustration 5-16 Assets section of a classified balance sheet PW AUDIO SUPPLY, INC. Balance Sheet (Partial) December 31, 2015 Assets Current assets Helpful Hint The $40,000 is the cost of the inventory on hand, not its expected selling price Cash Accounts receivable Inventory Prepaid insurance 100 Total current assets Property, plant, and equipment Equipment Less: Accumulated depreciation-equipment $80,000 24,000 Total assets 296 6 Inventories Determine the value of the company's invent ory under the lower-of-cost-or mar Solution entory type is gas $79,000, wood $250,000, and pelle. Action Plan The lowest value for e Determine whether cost or market value is lower for each inventory type. $101.000. The total inventory value is the sum of these amounts, $430,000 lue (b) Visual Company overstated its 2014 ending inventory by $22,000. Deter to impact this error has on ending inventory, cost of goods sold, and stockholders al V Sum the lowest val 2014 and 2015 determine the total value of inventory Solution 2014 $22,000 overstated $22,000 understated $22,000 overstated Action Plan 2015 V An ending inventory error in one period will have an equal and opposite effect on cost of goods sold and net income in the next period. No effect Ending inventory Cost of goods sold Stockholders' equity $22,000 overstated No effect 6-3. Related exercise materal: BE6-7, BE6-8, E6-9, E6-10, E6-11, E6-12, and DO IT After two years, the errors have offset each oth The Navigator Statement Presentation and Analysis Presentation LEARNING OBJECTIVE 6 Discuss the presentation As indicated in Chapter 5, inventory is classified in the balance sheet as a current and analysis of inventory.asset immediately below receivables. In a multiple-step income statement, cost goods sold is subtracted from sales. There also should be disclosure of (1) the major inventory classifications, (2) the basis of accounting (cost, or lower-of-cost or-market), and (3) the cost method (FIFO, LIFO, or average-cost) Wal-Mart Stores, Inc., for example, in its January 31, 2011, balance sheet reported inventories of $36,318 million under current assets. The accompanying notes to the financial statements, as shown in Illustration 6-21, disclosed the following information Illustration 6-21 Real Inventory disclosures by Wal-Mart WAL-MART STORES, INC. Notes to the Financial Statements Note 1. Summary of Significant Accounting Policies Inventories The Company values inventories at the lower of cost or market as determ by the retail method of accounting, using the last-in, first-out (CLIFO substantially all of the WalMart U.S. segment's merchandise inventomare method of accounting results in inventory being valued at the lower of cost since permanent markdowns are currently taken as a reduction of the reaeht inventory. The Sam's Club segment's merchandise is valued based on the average cost using the LIFO method. Inventories for the Walmart usi operations are primarily valued by the retail method of accounting and are aentoris the first-in, first-out ('FIFO") method. At January 31, 2011 and 2010, ou valued at LIFO approximate those inventories as if they were valued at Fl pl ined prim to lev dis As indicated in this note, Wal-Mart values its inventories market using LIFO and FIFO. You need the textbook to do this assignment. The main purpose of this assignment is to see the general picture of different events and transactions we covered during this course. You should be able to understand financial statements components 1) Read material from the textbook related to financial statements and ratios: Chl. Financial Statements p 22-25, Ch4. The Classified Balance Sheet p. 181-187. Ch5. Forms of financial statements: p.236-240, Ch.6 Statement Presentation and Analysis: p.296-297 Ch.8 Statement Presentation and Analysis: p.405, Ch.9 Statement Presentation and Analysis: p 450-451, Ch. 10 Statement Presentation and Analysis: p.488-489, p.502-503. p. Ch.11 Statement Presentation and Analysis: p.573-574 2) Calculate ratios for the Coca-Cola company (Appendix C in the textbook) You can find the ratios in the first part of this assignment. There should be 10 ratios. 22 1 Accounting in Action Solution Stockholders' Equity Liabilities + Accounts Common Payable Stock Assets Retained Earnings Cash Equipment Transaction (1) +$25,000 +$25,000 +$7,000 Service Revenue Rent Expense +$8,000 +8,000 850 1,000 $1,000 Dividends 31,150 $7,000$7,000 $25,000$8,000 $850 $1,000 $38,150 Related exercise material: BE1-6, BE1-7, BE1-8, BE1-9, E1-6, E1-7, E1-8, E1-9, E1-10, and bo 1-3. The Navigator Financial Statements Companies prepare four financial statements from the summarized accounting data LEARNING OBJECTIVE 8 Understand the four financial statements and how they are prepared 1. An income statement presents the revenues and expenses and resulting net income or net loss for a specific period of time 2. A retained earnings statement summarizes the changes in retained earnings for a specific period of time 3. A balance sheet reports the assets, liabilities, and stockholders' equity Note of a company at a specific date. The primary types of financial 4. A statement of cash flows summarizes information about the cash statements required by GAAP and IFRS are the same. In practice some format inflows (receipts) and outflows (payments) for a specific period of time These statements provide relevant financial data for internal and exter Note that the statements shown in Illustration 1-10 are interrelated: t differences do exist in presentations employed by users. Illustration 1-10 shows the financial statements GAAP companies compared to IFRS companies. 1. Net income of $2,750 on the income statement is added to the begin- ning balance of retained earnings in the retained earnings statement 2. Retained earnings of $1,450 at the end of the reporting period shown in the Helpful Hint The income statement, retained earnings state- ment, and statement of cash flows are all for a period of time, whereas the balance sheet is for a point in time retained earnings statement is reported on the balance sheet. 3. Cash of $8,050 on the balance sheet is reported on the statement of cash flows Also, explanatory notes and supporting schedules are an integral part of ev set of financial statements. We illustrate these notes and schedules in later chap ters of this textbook. Be sure to carefully examine the format and content of each statement in llustration 1-10. We describe the essential features of each in the following sections. Income Statement The income statement reports the success or profitability of the company operations over a specific period of time. For example, Softbyte Inc.'s income sta ment is dated "For the Month Ended September 30, 2015." It is prepared from the data appearing in the revenue and expense columns of Illustration 1-9 (page 21 Financial Statements 23 SOFTBYTE INC. Income Statement For the Month Ended September 30, 2015 Illustration 1-10 Financial statements and their interrelationships Revenues Service revenue Helpful Hint The heading of each statement identifies the company, the type of statement, and the specific date or time period cov- ered by the statement Expenses Salaries and wages expense Rent expense Advertising expense Utilities expense 600 250 Total expenses Net income $2,750 SOFTBYTE INC. Retained Earnings Statement For the Month Ended September 30, 2015 Retained earnings, September 1 Add: Net income Helpful Hint 2,750Note that final sums are double-underlined, and negative amounts (in the Less: Dividends Retained earnings, September 30 statement of cash flows) $1,450 are presented in parentheses SOFTBYTE INC. Balance Sheet September 30, 2015 Assets $ 8,050 Cash Accounts receivable Supplies Equipment $18,050 Total assets Liabilities and Stockholders' Equity Liabilities S 1,600 Accounts payable Stockholders' equity Common stock Retained earnings $15,000 1,450 $18,050 Total liabilities and stockholders' equity SOFTBYTE INC. Statement of Cash Flows For the Month Ended September 30, 2015 Helpful Hint The arrows in this illustration show the interrelationships of the four financial Cash flows from operating activities Cash receipts from revenues Cash payments for expenses Net cash provided by operating activities $ 3,300 (1.950) 1,350 1. Net income is computed first and is needed to determine the ending balance in retained earnings. 2. The ending balance in retained earnings is needed in preparing the balance sheet. 3. The cash shown on the balance sheet is needed in preparing the statement of cash flows Cash flows from investing activities Purchase of equipment Cash flows from financing activities Sale of common stock Payment of cash dividends $15,000 (1.300) 13.700 8,050 0 $8,050 Net increase in cash Cash at the beginning of the period +Cash at the end of the period 24 1 Accounting in Action The heading of the statement identifies the company, the type of statement, and the time period covered by the statement. Alternative Terminology The income statement is somestatement shows net income (or net loss). When revenues exceed expenses, net times referred to as the statement of operations, earmings statement The income statement lists revenues first, followed by expenses. Finally, the income results. When expenses exceed revenues, a net loss results Although practice varies, we have chosen in our illustrations and homework solutions to list expenses in order of magnitude. (We will consider alternative or profit and loss statement Iternative Terminology notes present snOnymous tenns that you may come across in practice formats for the income statement in later chapters.) Note that the income statement does not include investment and dividend transactions between the stockholders and the business in measuring net ome. For example, as explained earlier, the cash dividend from Softbyte Inc was not regarded as a business expense. This type of transaction is consid- ered a reduction of retained earnings, which causes a decrease in stockholders equity Retained Earnings Statement Softbyte Inc.'s retained earnings statement reports the changes in retained earn ings for a specific period of time. The time period is the same as that covered by the income statement ("For the Month Ended September 30, 2015"). Data for the preparation of the retained earnings statement come from the retained earnings lumns of the tabular summary (Illustration 1-9) and from the income state ment (Illustration 1-10, page 23) The first line of the statement shows the beginning retained earnings amount. Then come net income and dividends. The retained earnings ending balance is the final amount on the statement. The information provided by this statement indicates the reasons why retained earnings increased or decreased during the period. If there is a net loss, it is deducted with dividends in the retained earnings statement Balance Sheet Softbyte Inc.'s balance sheet reports the assets, liabilities, and stockholders equity at a specific date (September 30, 2015). The company prepares the bal- ance sheet from the column headings and the month-end data shown in the l line of the tabular summary (Illustration 1-9) Observe that the balance sheet lists assets at the top, followed by liabilities and stockholders' equity. Total assets must equal total liabilities and stockholders equity. Softbyte Inc. report heet. In most cases, there will be more than one liability. When two or mo liabilities are involved, a customary way of listing is as shown in Illustration 1-11. s only one liability, Accounts Payable, on its b llustration 1-11 Presentation of liabilities Liabilities Notes payable Accounts payable Salaries and wages payable 10,000 63,000 Total liabilities $91,000 Financial Statements 25 The balance sheet is like a snapshot of the company's financial condition at a cific moment in time (usually the month-end or year-end) Statement of Cash Flows The statement of cash flows provides information on the cash receipts and pay ments for a specific period of time. The statement of cash flows reports (1) the cash effects of a company's operations during a period, (2) its investing activities, Helpful Hint 3) its financing activities, (4) the net increase or decrease in cash during the period, Investing activities pertain and (5) the cash amount at the end of the period to investments made by the Reporting the sources, uses, and change in cash is useful because investors, company, not investments creditors, and others want to know what is happening to a company's most liquid made by the owners urce. The statement of cash flows provides answers to the following simple ut important questions. 1. Where did cash come from during the period? 2. What was cash used for during the period? 3. What was the change in the cash balance during the period? As shown in Softbyte Inc.'s statement of cash flows in Illustration 1-10, cash increased $8,050 during the period. Net cash provided by operating activities in- creased cash $1,350. Cash flow from investing activities decreased cash $7.000 while cash flow from financing activities increased cash $13,700. At this time you need not be concerned with how these amounts are determined. Chapter 13 will examine in detail how the statement is prepared. PEOPLE, PLANET, AND PROFIT INSIGHT Planet Beyond Financial Statements 3BL Should we expand our financial statements beyond the income statement, retained statement, balance sheet, and statement of cash flows? Some believe we should take into account ecological and social performance, in addition to financial results, in evaluati company. The argument is that a company's responsibility lies with anyone who is influenced by its actions. In other words, a company should be interested in benefiting many differ parties, instead of only maximizing stockholders' interests. earnings ent A socially responsible business does not exploit or endanger any group of individuals follows fair trade practices, provides safe environments for worker for environmental damage. Granted, measurement of these factors is difficult. Ho s, and bears responsibility w to report nderway we provide additional insights into how companies are attempting nformation is also controversial. But, many interesting and useful efforts are u s i hroughout this textbook, meet the challenge of measuring and reporting their contributions to society their financial results, to stockholders. Why might a company's stockholders be interested in its environmental and social performance? (See page 49.) The Classified Balance Sheet 181 Comparison of the two entries shows that two accounts are incorrect. Equip- ment is understated $405, and Accounts Payable is understated $405. Mercato makes the following correcting entry. Correcting Entr June 3 Equipment SE Accounts Payable 405 +405 405 +405 To correct entry of May 18) Cash Flows no effect Instead of preparing a co entry and then prepare the rrecting entry, it is possible to reverse the incorrect Illustration 4-15 ecorect entry. This approach will result in more Correcting entry Thi tries and postings th an a correcting entry, but it will accomplish the desired result. en ACCOUNTING ACROSS THE ORGANIZATION Yale Express Loses Some Transportation Bills Yale Ex plete deliveries. Yale collected the entire delivery charge. When billed by the local trucker, Yale sent payment for the final phase to the local trucker. Yale used a cutoff period of 20 days into the next accounting period in making its adjusting entries for accrued liabilities. That is, it waited 20 days to receive the local truckers' bills to determine the amount of the unpaid but incurred delivery charges as of the balance sheet date. s, a short-haul trucking firm, turned over much of its cargo t o local truckers to com On the other hand, Republic Carloading, a nationwide, long-distance freight forwarder frequently did not receive transportation bills from truckers to whom it passed on cargo until months after the year-end. In making its year-end adjusting entries, Republic waited for months in order to include all of these outstanding transportation bills When Yale Express merged with Republic Carloading, Yale's vice president employed the 20-day cutoff procedure for both firms. As a result, millions of dollars of Republic's accrued transportation bills went unrecorded. When the company detected the error and made correcting entries, these and other errors changed a reported profit of $1.14 million into a loss of $1.88 million! What might Yale Express's vice president have done to produce more accurate financial statements without waiting months for Republic's outstanding transportation bills? (See page 215.) The Classified Balance Sheet The balance sheet presents a snapshot of a company's financial position at a point in time. To improve users' understanding of a company's financial position, companies often use a classified balance sheet. A classified balance sheet Identify the sections of a groups together similar assets and similar liabilities, using a number of standard classified balance sheet. classifications and sections. This is useful because items within a group have imilar economic characteristics. A classified balance sheet generally contains the standard classifications listed in Illustration 4-16 LEARNING OBJECTIVE 6 Illustration 4-16 Standard balance sheet classifications Liabilities and Stockholders' Equity Current liabilities Long-term liabilities Stockholders' equity Assets Current assets Long-term investments Property, plant, and equipment Intangible assets 182 4 Completing the Accounting Cycle These groupings help financial statement readers determine such things as ( whether the company has enough assets to pay its debts as they come due (2) the claims of short- and long-term creditors on the company's total assets. Man of these groupings can be seen in the balance sheet of Franklin Corporation showhy Illustration 4-17 below. In the sections that follow, we explain each of these groupings Illustration 4-17 Classified balance sheet FRANKLIN CORPORATION Balance Sheet October 31, 2015 Assets Current assets Cash Debt investments Accounts receivable Notes receivable Inventory Supplies Prepaid insurance 6,600 2,000 7,000 1,000 3,000 2,100 400 Total current assets $22,100 Long-term investments Stock investments Investment in real estate 5,200 2,000 7,200 Property, plant, and equipment 10,000 Land Equipment Less: Accumulated depreciation- $24,000 5,000 19,000 29,000 quipment Intangible assets 3,100 S61,400 Patents Total assets Liabilities and Stockholders' Equit Helpful Hint Recall that the basic accounting equation is Assets Liabilities+ Stockholders Equity. Current liabilities Notes payable Accounts payable Unearned service revenue Salaries and wages payable Interest payable $11,000 2,100 900 600 450 Total current liabilities $16,050 Long-term liabilities Mortgage payable Notes payable 10,000 Total long-term liabilities 1.300 1.300 Total liabilities Stockholders' equity Retained earnings 27,350 Common stock 20,000 14,050 Total stockholders' equity Total liabilities and stockholders' equity 34,050 $61,400 Current Assets Current assets are assets that a company expects to convert to cash or u within one year or its operating cycle, whichever is longer. In Illustratio Franklin Corporation had current assets of $22,100. For most businesses the The Classified Balance Sheet 183 utoff for classification as current assets is one year from the balance sheet date example, accounts receivable are current assets because the company will lect them and convert them to cash within one year. Supplies is a current asset ctl co because the company expects to use them up in operations within one year Some companies use a period longer than one year to classify assets and la- bilities as current because they have an operating cycle longer than one year. The ting cycle of a company is the average time that it takes to purchase inven sell it on account, and then collect cash from customers. For most busi s, this cycle takes less than a year, so they use a one-year cutoff. But, for me businesses, such as vineyards or airplane manufacturers, this pe ma nies use one year to determine whether an asset or liability is current or long-term riod y be longer than a year. Except where noted, we will assume that compa Common types of current assets are (1) cash, (2) nvest men U.S. government securities), (3) receivables (notes receivabl ivable, and interest receivable), (4) inventories, and (5) prepaid ex ts (such as short (supplies and insurance). On the balance sheet, companies usually list these items in the order in which they expect to convert them into cash. llustration 4-18 presents the current assets of Southwest Airlines Co SOUTHWEST AIRLINES co Balance Sheet (partial) Illustration 4-18 Current assets section Real Current assets $1,390 Cash and cash equivalents Short-term investments Accounts receivable Inventories Prepaid expenses and other current assets 241 181 420 Total current assets $2,601 As assessing its short-term debt-paying ability. Long-Term Investments Long-term investments are generally (1) investments in stocks and bonds of explained later in the chapter, a company's current assets are important in Alternative Terminology as land or buildings that a company is not currently using in its operating referred to simply as investments vities, and (3) long-term notes receivable. In Illustration 4-17, Franklin poration reported total long-term investments of $7,200 on its balance er companies that are normally held for many years, (2) long-term assets Long-term investments are often et. Yahoo! Inc. reported long-term investments in its balance sheet as shown in Ilustration 4-19 Illustration 4-19 Long-term investments section YAHOO! INC. Real rl Balance Sheet (partial) (in thousands) Long-term investments $90,266 Investments in securities Property, Plant, and Equipment Alternative Property, plant, and equipment is sometimes called fixed assets or plant assets. Terminology Property, plant, and equipment are assets with relatively long a company is currently using in operating the business. This catego land, buildings, machinery and equipment, delivery equipmen niture. In Illustration 4-17, Franklin Corporation reported po plant, and equipment of $29,000 International Depreciation is the practice of allocating the cost of as number of years. Companies do this by systematically assig assets to a Note Recently, China adopted International Financial Reporting tion of an asset's cost a Standards (IFRS). Thi in an effort to reduce fraud and depreciates are reported on the balance sheet at cost less accumulated increase investor confidence in depreciation. The accumulated deprecia financial reports. Under these standards, many items, such as asset's life. In Illustration 4-17, Franklin Corporation reported accumu property, plant, and equipment may be reported at currentfailated depreciation of $5,000 in tional Financial Reporting tion of an asset's cost as an expense each year (rather than ex g t pany the co full purchase price in the year of purchase). The assets that The accumulated depreciation account shows the us far total amount of depreciation that the company has expensed th Illustration 4-20 presents the property, plant, and equipment of Cooper Tire & Rubber Company values rather than historical cost. Illustration 4-20 Property, plant, and equipment section COOPER TIRE & RUBBER COMPANY Balance Sheet (partial) (in thousands) Rea Property, plant, and equipment S 41,553 298,706 1,636,091 268,158 Land and land improvements Machinery and equipment Molds, cores, and rings Less: Accumulated depreciatiorn $2,244,508 1,252,692 S 991,816 Intangible Assets Many companies
Step by Step Solution
There are 3 Steps involved in it

Get step-by-step solutions from verified subject matter experts