Answered step by step
Verified Expert Solution
Question
1 Approved Answer
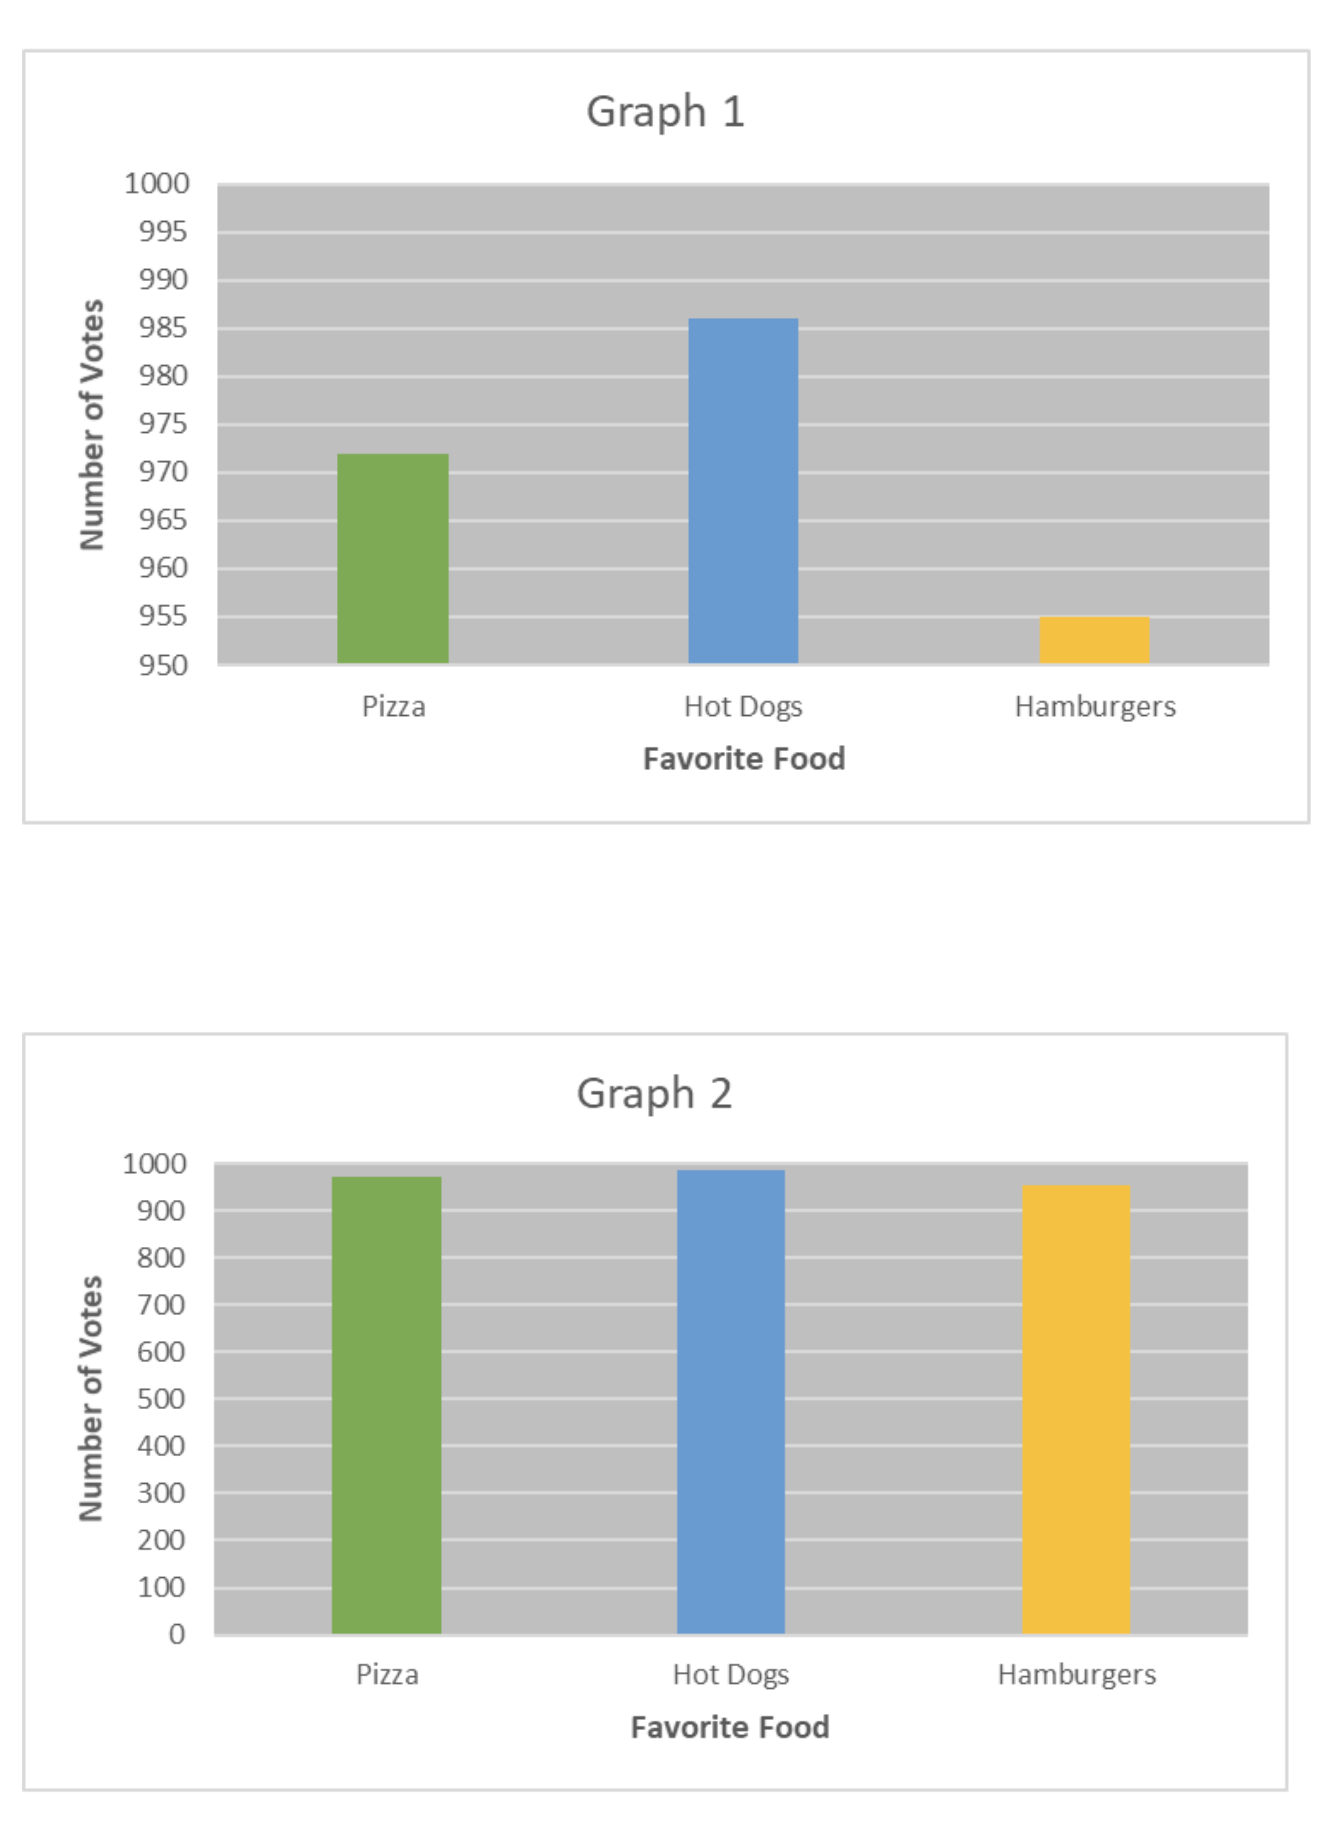
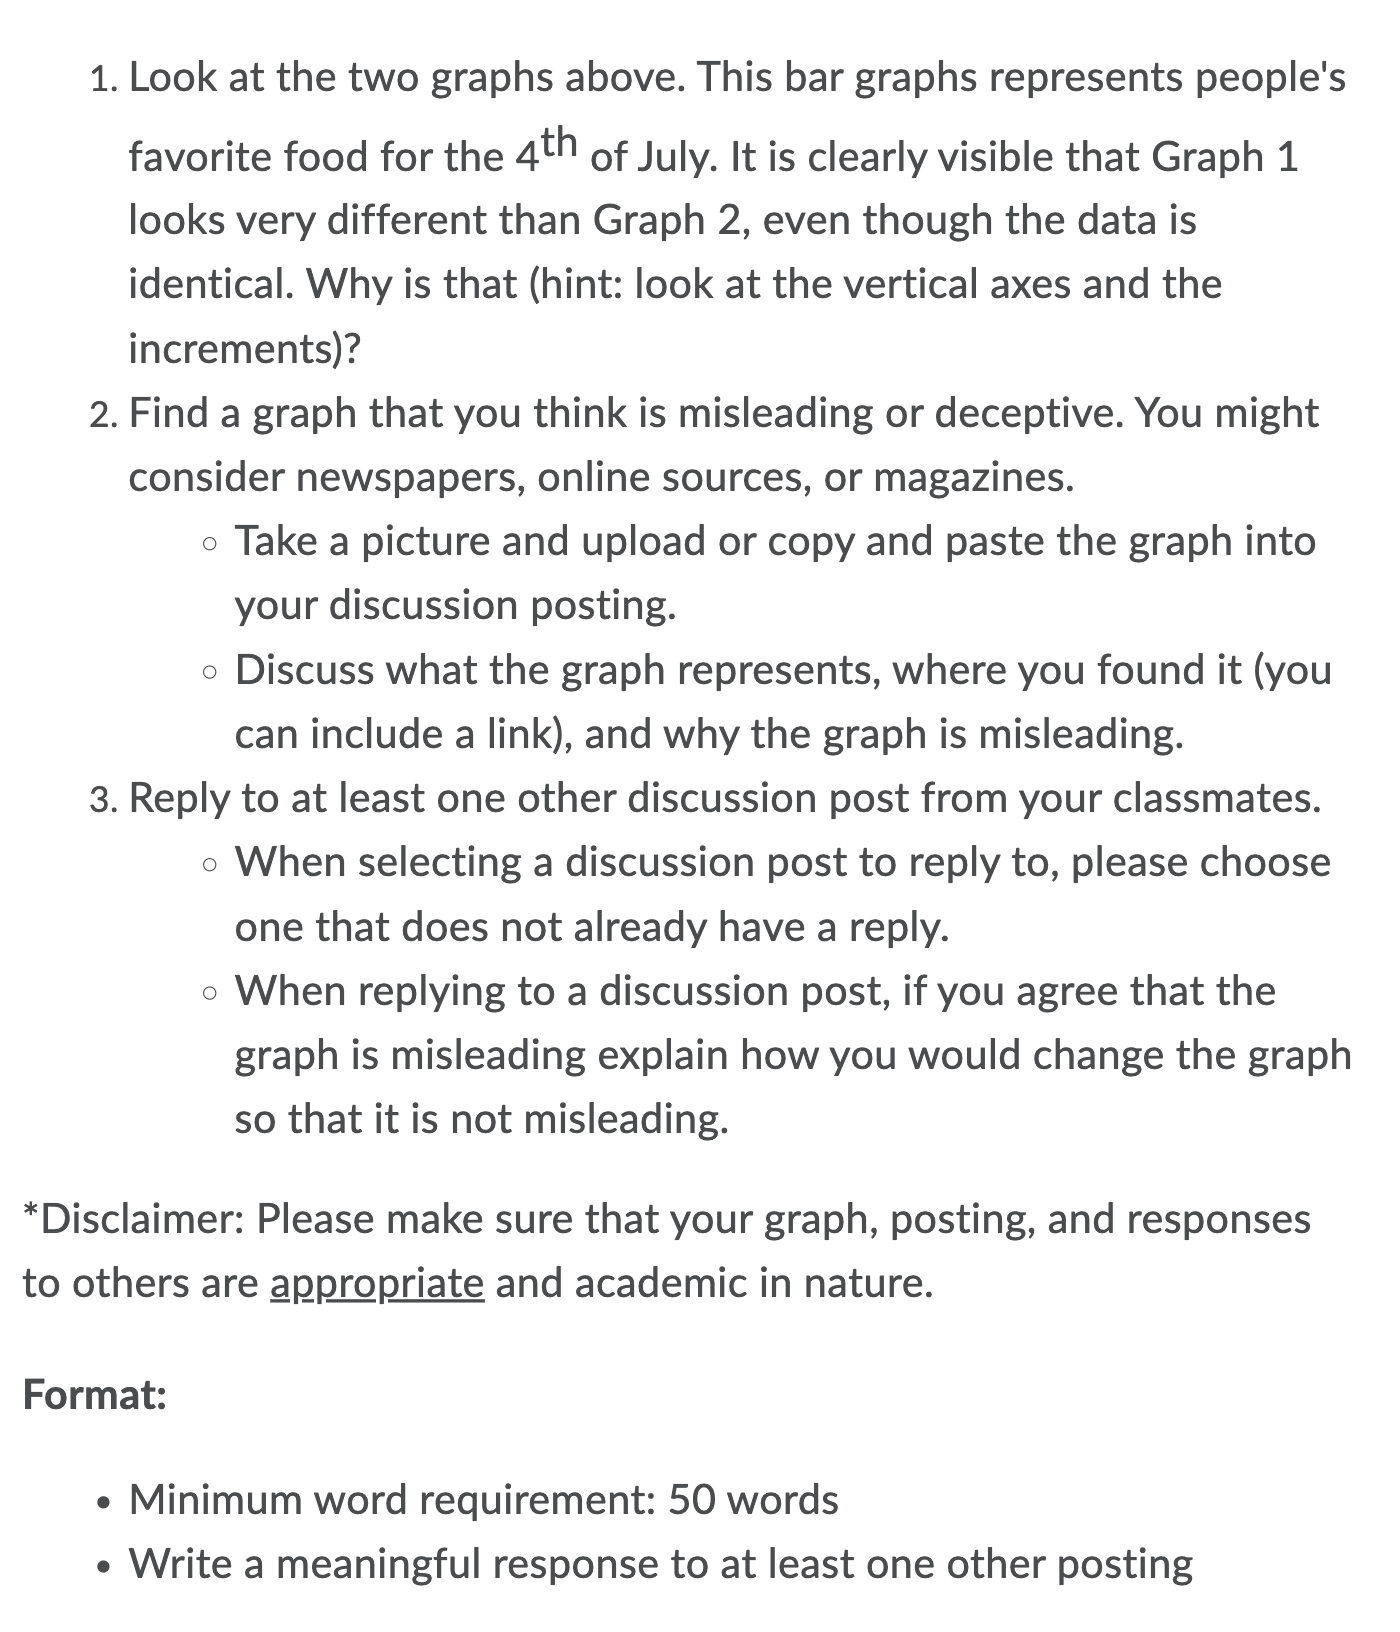
Please, someone, help me answer these questions below the graphs. NOTE: I NEED ANSWERS ONLY FOR 1 AND 2 Number of Votes Hot Dogs Hamburgers
Please, someone, help me answer these questions below the graphs.
NOTE: "I NEED ANSWERS ONLY FOR 1 AND 2"
Number of Votes Hot Dogs Hamburgers Favorite Food > "5 .3 E = 2 Hot Dogs Hamburgers Favorite Food 1. Look at the two graphs above. This bar graphs represents people's favorite food for the 4th of July. It is clearly visible that Graph 1 looks very different than Graph 2, even though the data is identical. Why is that (hint: look at the vertical axes and the increments)? 2. Find a graph that you think is misleading or deceptive. You might consider newspapers, online sources, or magazines. 0 Take a picture and upload or copy and paste the graph into your discussion posting. 0 Discuss what the graph represents, where you found it (you can include a link), and why the graph is misleading. 3. Reply to at least one other discussion post from your classmates. 0 When selecting a discussion post to reply to, please choose one that does not already have a reply. 0 When replying to a discussion post, if you agree that the graph is misleading explain how you would change the graph so that it is not misleading. *Disclaimer: Please make sure that your graph, posting, and responses to others are appr_opriate and academic in nature. Format: . Minimum word requirement: 50 words . Write a meaningful response to at least one other postingStep by Step Solution
There are 3 Steps involved in it
Step: 1
Get Instant Access to Expert-Tailored Solutions
See step-by-step solutions with expert insights and AI powered tools for academic success
Step: 2
Step: 3
Ace Your Homework with AI
Get the answers you need in no time with our AI-driven, step-by-step assistance
Get Started