Answered step by step
Verified Expert Solution
Question
1 Approved Answer
Please someone help me with this pracfice question. Someone help with this Practice Question. FIGURE 1.1 A $1 Investment in Different Types of Portfolios: 19262018
Please someone help me with this pracfice question. 


Someone help with this Practice Question. 

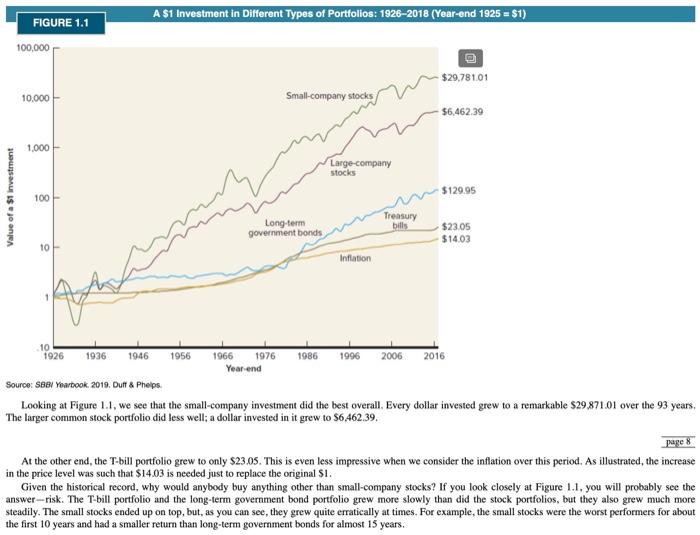
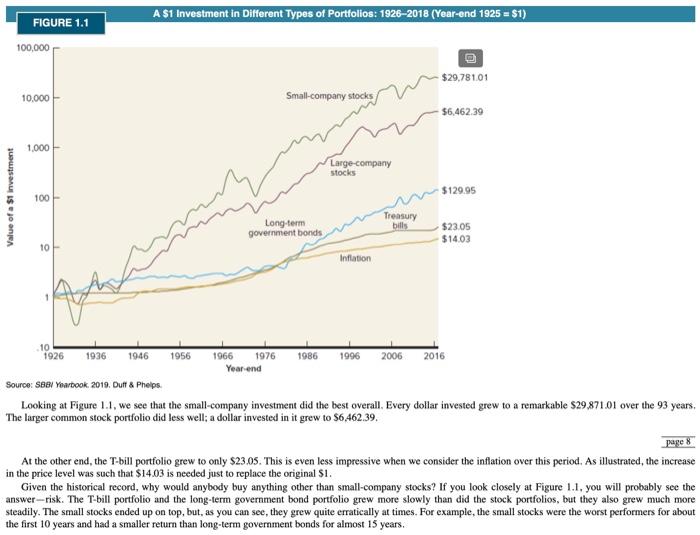
FIGURE 1.1 A $1 Investment in Different Types of Portfolios: 19262018 (Year-end 1925 = 51) 100,000 $29,781.01 10,000 Small-company stocks $6,462.39 1.000 Large-company stocks $129.95 Value of a $1 investment 100 Long-term government bonds Treasury bills $23.05 $1403 10 Inflation .10 1926 1986 1936 1946 1956 1966 1976 1996 2006 2016 Year-end Source: SBS Yearbook 2019. Duff & Phelps Looking at Figure 1.1, we see that the small-company investment did the best overall. Every dollar invested grew to a remarkable $29.871.01 over the 93 years, The larger common stock portfolio did less well; a dollar invested in it grew to $6,462.39, page 8 At the other end, the T-bill portfolio grew to only $23.05. This is even less impressive when we consider the inflation over this period. As illustrated, the increase in the price level was such that $14.03 is needed just to replace the original S1. Given the historical record, why would anybody buy anything other than small-company stocks? If you look closely at Figure 1.1, you will probably see the answer-risk. The T-bill portfolio and the long-term government bond portfolio grew more slowly than did the stock portfolios, but they also grew much more steadily. The small stocks ended up on top, but, as you can see, they grew quite erratically at times. For example, the small stocks were the worst performers for about the first 10 years and had a smaller return than long-term government bonds for almost 15 years. 10. Returns and the Bell Curve (LO4, CFA3) An investment has an expected return of 11 | Assuming that the returns on this investment are at least roughly normally distributed, how percent? How often do you expect to earn less than -13 percent? FIGURE 1.1 A $1 Investment in Different Types of Portfolios: 19262018 (Year-end 1925 = 51) 100,000 $29,781.01 10,000 Small-company stocks $6,462.39 1.000 Large-company stocks $129.95 Value of a $1 investment 100 Long-term government bonds Treasury bills $23.05 $1403 10 Inflation .10 1926 1986 1936 1946 1956 1966 1976 1996 2006 2016 Year-end Source: SBS Yearbook 2019. Duff & Phelps Looking at Figure 1.1, we see that the small-company investment did the best overall. Every dollar invested grew to a remarkable $29.871.01 over the 93 years, The larger common stock portfolio did less well; a dollar invested in it grew to $6,462.39, page 8 At the other end, the T-bill portfolio grew to only $23.05. This is even less impressive when we consider the inflation over this period. As illustrated, the increase in the price level was such that $14.03 is needed just to replace the original S1. Given the historical record, why would anybody buy anything other than small-company stocks? If you look closely at Figure 1.1, you will probably see the answer-risk. The T-bill portfolio and the long-term government bond portfolio grew more slowly than did the stock portfolios, but they also grew much more steadily. The small stocks ended up on top, but, as you can see, they grew quite erratically at times. For example, the small stocks were the worst performers for about the first 10 years and had a smaller return than long-term government bonds for almost 15 years. 10. Returns and the Bell Curve (LO4, CFA3) An investment has an expected return of 11 percent per year with a standard deviation of 24 percent. Assuming that the returns on this investment are at least roughly normally distributed, how frequently do you expect to earn between - 13 percent and 35 percent? How often do you expect to earn less than-13 percent 

Step by Step Solution
There are 3 Steps involved in it
Step: 1

Get Instant Access to Expert-Tailored Solutions
See step-by-step solutions with expert insights and AI powered tools for academic success
Step: 2

Step: 3

Ace Your Homework with AI
Get the answers you need in no time with our AI-driven, step-by-step assistance
Get Started


