

Answered step by step
Verified Expert Solution
Question
1 Approved Answer
please specify which answer is for which question.Please not wrong answers Thanks! Problem set 1. (max 55 points) The present analysis aims to quantify the
please specify which answer is for which question.Please not wrong answers Thanks! 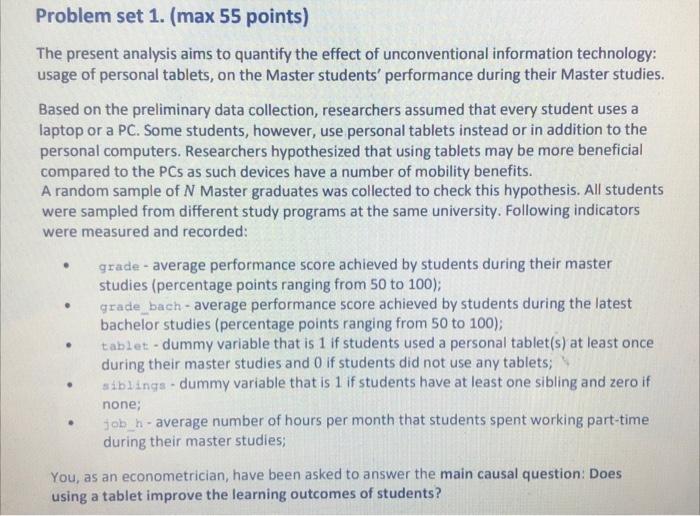
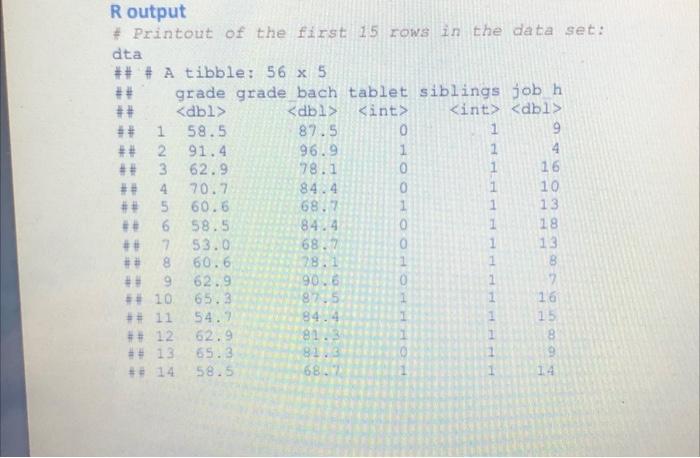
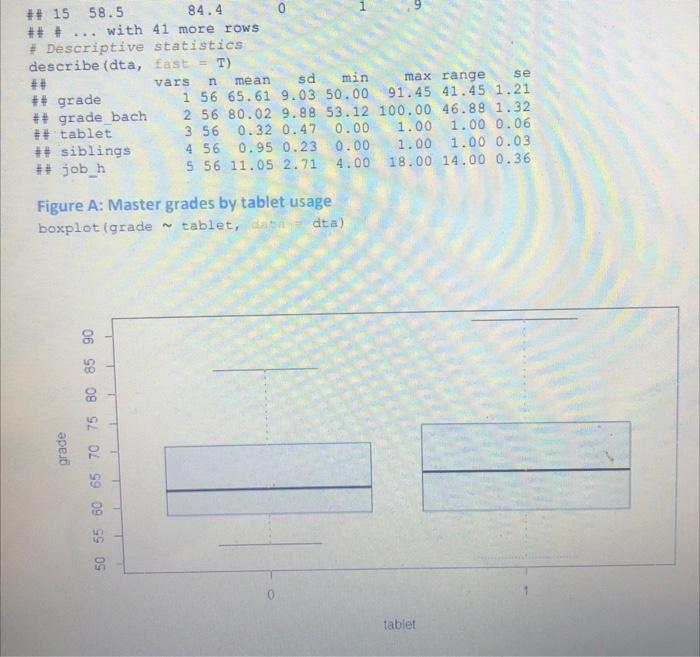
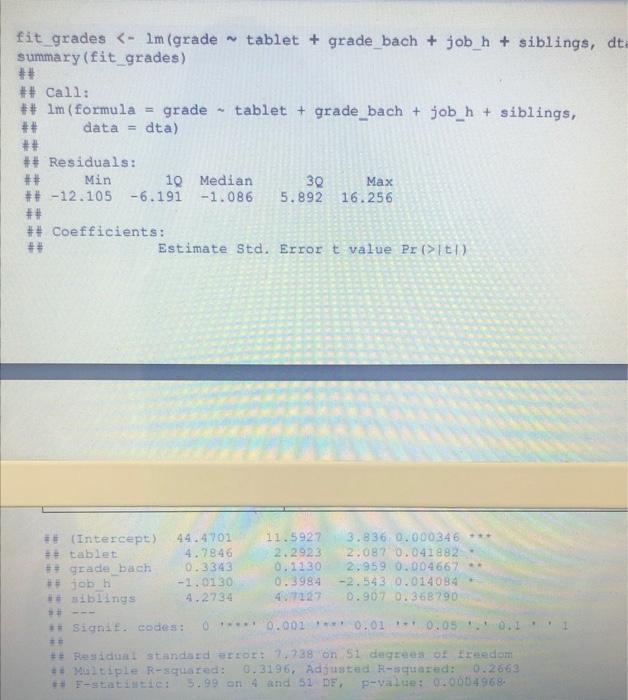
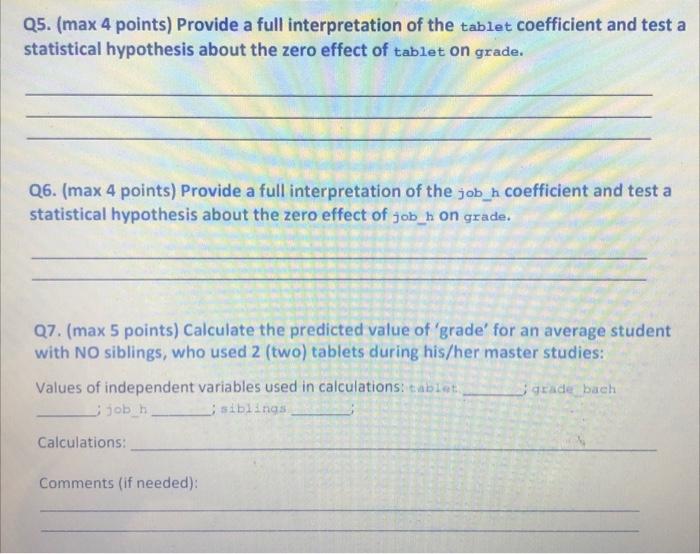
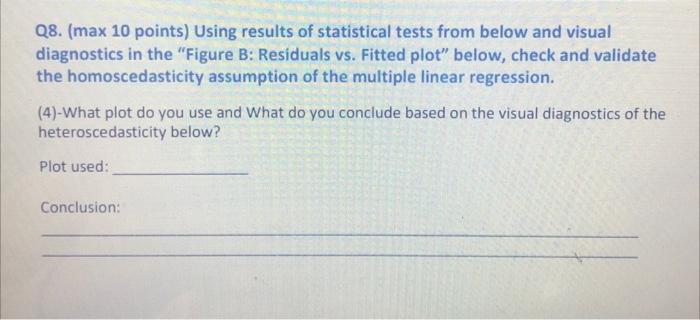
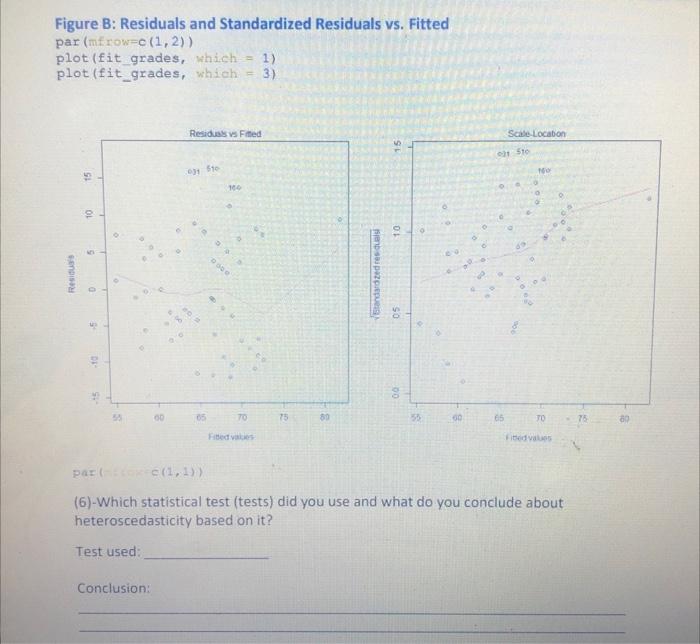
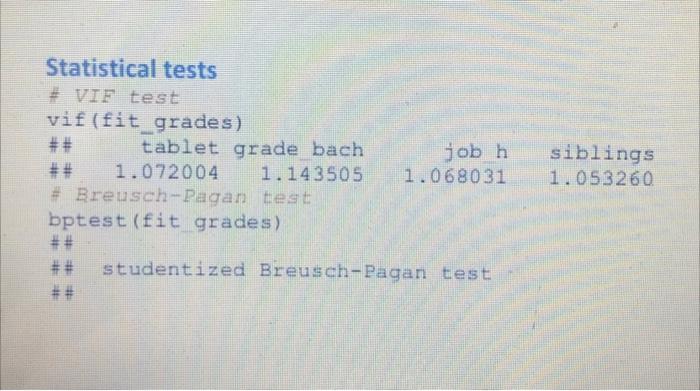
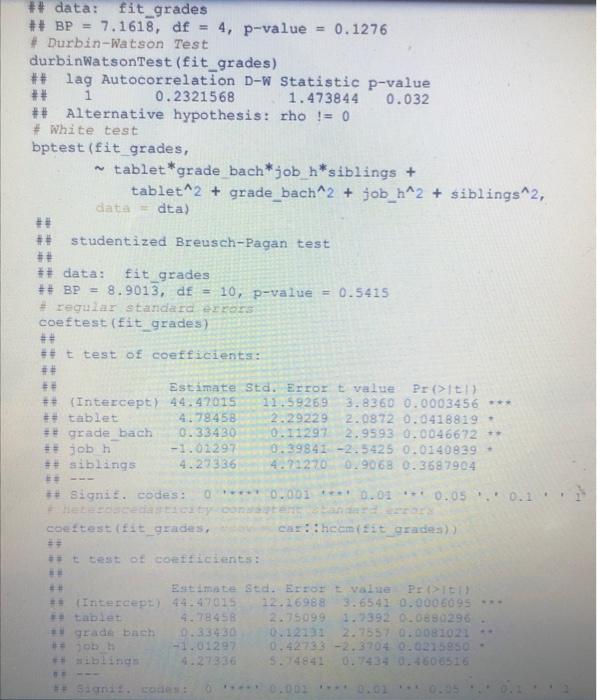
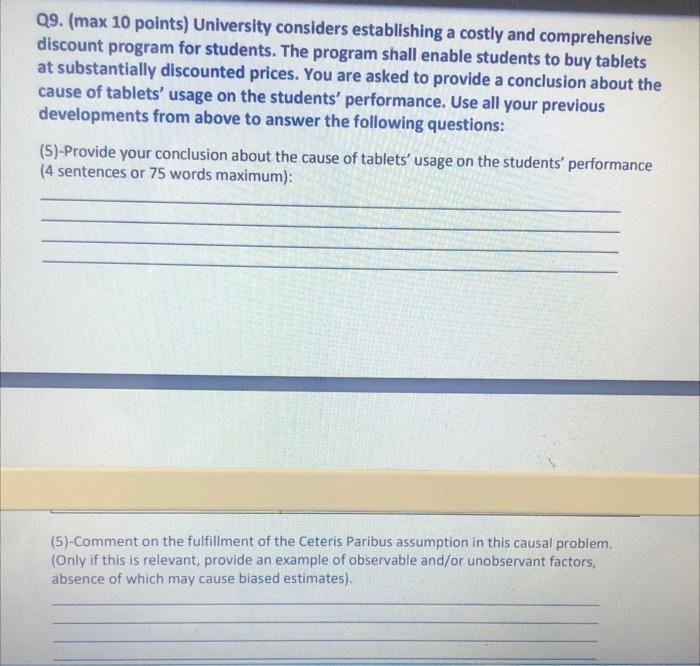
Problem set 1. (max 55 points) The present analysis aims to quantify the effect of unconventional information technology: usage of personal tablets, on the Master students' performance during their Master studies. Based on the preliminary data collection, researchers assumed that every student uses a laptop or a PC. Some students, however, use personal tablets instead or in addition to the personal computers. Researchers hypothesized that using tablets may be more beneficial compared to the PCs as such devices have a number of mobility benefits. A random sample of N Master graduates was collected to check this hypothesis. All students were sampled from different study programs at the same university. Following indicators were measured and recorded: . grade - average performance score achieved by students during their master studies (percentage points ranging from 50 to 100); grade_bach - average performance score achieved by students during the latest bachelor studies (percentage points ranging from 50 to 100); tablet- dummy variable that is 1 if students used a personal tablet(s) at least once during their master studies and 0 if students did not use any tablets siblings - dummy variable that is 1 if students have at least one sibling and zero if none; Job n-average number of hours per month that students spent working part-time during their master studies . . You, as an econometrician, have been asked to answer the main causal question: Does using a tablet improve the learning outcomes of students? ## A 1 Routput # Printout of the first 15 rows in the data set: dta ## # A tibble: 56 x 5 ## grade grade bach tablet siblings job h - ## 1 58.5 87.5 1 9 ## 2 91.4 96.9 1 1 4 ## 3 62.9 78.1 1 16 ## 70.7 84.4 1 10 ## 5 60.6 68.7 1 13 6 58.5 84.4 1 18 ## 7 53.0 68.7 1 13 8 60.6 28.1 1 B # 62.9 90.6 1 2 ## 10 65.3 87.5 1 16 ## 11 54.7 84.4 15 ## 12 62.9 81. ## 13 65. 3 81.3 1 9 ## 14 58.5 686 14 HAOOOOOOO DOO WOODV ## 0 +-+ n ## 15 58.5 84.4 ## # with 41 more rows # Descriptive statistics describe (dta, East = T) ## vars mean sd min max range se ## grade 1 56 65.61 9.03 50.00 91.45 41.45 1.21 ## grade bach 2 56 80.02 9.88 53.12 100.00 46.88 1.32 ## tablet 3 56 0.32 0.47 0.00 1.00 1.00 0.06 ## siblings 4 56 0.95 0.23 0.00 1.00 1.00 0.03 ** job_h 5 56 11.05 2.71 4.00 18.00 14.00 0.36 Figure A: Master grades by tablet usage boxplot (grade tablet, data dta) 75 80 85 90 grade 60 65 70 50 55 tablet fit grades 101) (Intercept) ++ tablet ** grade bach ** jobb *+ siblings 44.4701 4.2846 0.3343 -1.0130 4.2734 11.5927 2.2923 0.1130 0.3984 4.7123 3.836 0.000346 *. 2.087 0.041882 2.959 0.004667 -2.543 0.014084 0.907 00368790 ** Sianit. codes: 0 0.001 0.01 0.05 ++ Residunt standard error: 2.738 on 51 degree of freedom + Moltiple R-squared: 0.3196, Adjustad R-squared: 0.2663 # F-statistie: 5.99 on 4 and 51 DE p-value: 0.0004968 Q5. (max 4 points) Provide a full interpretation of the tablet coefficient and test a statistical hypothesis about the zero effect of tablet on grade. Q6. (max 4 points) Provide a full interpretation of the job_h coefficient and test a statistical hypothesis about the zero effect of job_h on grade. Q7. (max 5 points) Calculate the predicted value of 'grade' for an average student with NO siblings, who used 2 (two) tablets during his/her master studies: Values of independent variables used in calculations tablets grade bach jobb siblings Calculations: Comments (if needed): Q8. (max 10 points) Using results of statistical tests from below and visual diagnostics in the "Figure B: Residuals vs. Fitted plot" below, check and validate the homoscedasticity assumption of the multiple linear regression. (4)-What plot do you use and What do you conclude based on the visual diagnostics of the heteroscedasticity below? Plot used: Conclusion: Figure B: Residuals and Standardized Residuals vs. Fitted par (mirow=c(1,2)) plot (fit grades, which 1) plot (fit_grades, which = 3) Residus Fred Scale Locabon SE 50 15 1 510 100 10 0 5 Standard zedres duas Resi 0 SO 10 00 00 09 70 75 89 55 00 65 TO 75 0 Fibed as Fitus per (1, 1)) (6)-Which statistical test (tests) did you use and what do you conclude about heteroscedasticity based on it? Test used: Conclusion: job h. Statistical tests # VIF test vif (fit grades) ## tablet grade bach ## 1.072004 1.143505 1.068031 # Breusch-Pagan test bptest (fit grades) ## ## studentized Breusch-Pagan test ## siblings 1.053260 O ## data: fit_grades ## BP = 7.1618, df = 4, p-value = 0.1276 # Durbin-Watson Test durbinWatsonTest (fit_grades) ## lag Autocorrelation D-W Statistic p-value ## 1 0.2321568 1.473844 0.032 ## Alternative hypothesis: cho != 0 # White test bptest (fit_grades, tablet*grade_bach*job_h*siblings + tablet^2 + grade_bach^2 + job_h^2 + siblings^2, data dta) ** ## studentized Breusch-Pagan test ## ## data: fit_grades ## BP = 8.9013, df = 10, p-value = 0.5415 # regular standard errors coeftest (fit grades) ## t test of coefficients: # Estimate Std. Errort value Pr>IEI ## (Intercept) 44.47015 11.59269 3.8360 0.0003456 *** ++ tablet 4.78458 2.29229 2.0872 0.0418819 ## grade bach 0.33430 0.11297 2.9593 0.0046672 ** ** jobh -1.02297 0.39841 -2.5425 0.0140839 # siblings 4.27336 4.71270 0...9068 0.3587904 ## * Signit. codes: 0 Eleocecantity Do coeftest (st_grades. 0.001 0.010.05.0.1 Lane heamfit grade) ** t test of coeficients: Estimate Std. ETEE Evalue PEDIE ** Intercept) 44.47015 1216988 3.6541 0.0006095 tablet 4.78458 2.75099 1.7392 0.0880296 grade bach 0.33430 0.12121 2.4557 0.0081021 -1.0129 0.42733 -2.3704 0.0215950 4.27336 5.4841 0.7434 0.4600516 Q9. (max 10 points) University considers establishing a costly and comprehensive discount program for students. The program shall enable students to buy tablets at substantially discounted prices. You are asked to provide a conclusion about the cause of tablets' usage on the students' performance. Use all your previous developments from above to answer the following questions: (5) Provide your conclusion about the cause of tablets' usage on the students' performance (4 sentences or 75 words maximum): (5)-Comment on the fulfillment of the Ceteris Paribus assumption in this causal problem. (Only if this is relevant, provide an example of observable and/or unobservant factors, absence of which may cause biased estimates)
Step by Step Solution
There are 3 Steps involved in it
Step: 1

Get Instant Access to Expert-Tailored Solutions
See step-by-step solutions with expert insights and AI powered tools for academic success
Step: 2

Step: 3
Ace Your Homework with AI
Get the answers you need in no time with our AI-driven, step-by-step assistance
Get Started
Sql Data Analytics Made Easy Your Step By Step Guide To Unlocking Datas Hidden Secrets Demystify Complex Concepts And Harness The Power Of Data To Drive Intelligent Decision Making Effortlessly
Authors: L D Knowings
1st Edition
B0CKHWZ35K, 979-8862830880