

Answered step by step
Verified Expert Solution
Question
1 Approved Answer
please submit by an Excel file!! thank you so much Change the Lease detail figures to resemble a new completed development using the following data.
please submit by an Excel file!!
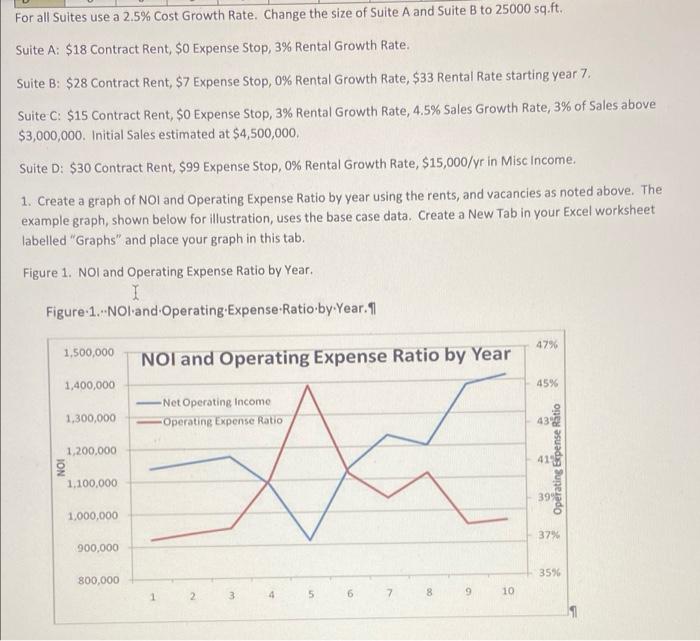
Change the Lease detail figures to resemble a new completed development using the following data. The vacancy and collections losses, by suite by year shown in the table below, assume that Suite B and Suite Dare preleased. Check Figure - NOI in Year 3 should be $1,190,892 3 11 Year/ 1 2 3 4 5 6 7 8 9 10 Suite 40 20 10 10 10 10 10 10 10 10 B 6 6 6 6 6 6 30 8 8 8 50 25 10 10 10 10 10 10 10 10 D 6 6 6 6 6 6 6 6 6 For all Suites use a 2.5% Cost Growth Rate. Change the size of Suite A and Suite B to 25000 sq.ft. Ol0 OD 10 8 10 6 00 Suite A: $18 Contract Rent, $0 Expense Stop, 3% Rental Growth Rate. Suite B: $28 Contract Rent, $7 Expense Stop, 0% Rental Growth Rate, $33 Rental Rate starting year 7. Suite C: $15 Contrat Rent $0 Expense Stop, 3% Rental Growth Rate, 4,5% Sales Growth Rate, 3% of Sales above $3,000,000. Initial Sales estimated at $4,500,000 Suite D: $30 Contract Rent, $99 Expense Stop, 0% Rental Growth Rate, $15,000/yr in Misc Income 1. Create a graph of NO and Operating Expense Ratio by year using the rents, and vacancies as noted above. The example graph, shown below for illustration, uses the base case data. Create a New Tab in your Excel worksheet labelled "Graphs" and place your graph in this tab. Figure 1. NOI and Operating Expense Ratio by Year. Figure 1. NOI and Operating Expense Ratio by Year. 1 4796 1,500,000 NOI and Operating Expense Ratio by Year 1,400,000 459 1,300,000 Net Operating Income -Operating Expense Ratio 1,200,000 41 Operating Expense Ratio 1,100,000 39 1.000.000 For all Suites use a 2.5% Cost Growth Rate. Change the size of Suite A and Suite B to 25000 sq.ft. Suite A: $18 Contract Rent $0 Expense Stop, 3% Rental Growth Rate. Suite B: $28 Contract Rent, $7 Expense Stop, 0% Rental Growth Rate, $33 Rental Rate starting year 7. Suite C: $15 Contract Rent, $o Expense Stop, 3% Rental Growth Rate, 4.5% Sales Growth Rate, 3% of Sales above $3,000,000. Initial Sales estimated at $4,500,000 Suite D: $30 Contract Rent, $99 Expense Stop, 0% Rental Growth Rate, $15,000/yr in Misc Income 1. Create a graph of NOI and Operating Expense Ratio by year using the rents, and vacancies as noted above. The example graph, shown below for illustration, uses the base case data. Create a New Tab in your Excel worksheet labelled "Graphs" and place your graph in this tab. Figure 1. NOI and Operating Expense Ratio by Year. I Figure 1.-NOI and Operating Expense Ratio-byYear. 1 479 1,500,000 NOI and Operating Expense Ratio by Year 1,400,000 45% 1,300,000 -Net Operating Income Operating Expense Ratio 1,200,000 41 NOI Opating tepense Ratio 1.100.000 39 1,000,000 37% 900,000 35% 800,000 3 4 6 8 9 10 Change the Lease detail figures to resemble a new completed development using the following data. The vacancy and collections losses, by suite by year shown in the table below, assume that Suite B and Suite Dare preleased. Check Figure - NOI in Year 3 should be $1,190,892 3 11 Year/ 1 2 3 4 5 6 7 8 9 10 Suite 40 20 10 10 10 10 10 10 10 10 B 6 6 6 6 6 6 30 8 8 8 50 25 10 10 10 10 10 10 10 10 D 6 6 6 6 6 6 6 6 6 For all Suites use a 2.5% Cost Growth Rate. Change the size of Suite A and Suite B to 25000 sq.ft. Ol0 OD 10 8 10 6 00 Suite A: $18 Contract Rent, $0 Expense Stop, 3% Rental Growth Rate. Suite B: $28 Contract Rent, $7 Expense Stop, 0% Rental Growth Rate, $33 Rental Rate starting year 7. Suite C: $15 Contrat Rent $0 Expense Stop, 3% Rental Growth Rate, 4,5% Sales Growth Rate, 3% of Sales above $3,000,000. Initial Sales estimated at $4,500,000 Suite D: $30 Contract Rent, $99 Expense Stop, 0% Rental Growth Rate, $15,000/yr in Misc Income 1. Create a graph of NO and Operating Expense Ratio by year using the rents, and vacancies as noted above. The example graph, shown below for illustration, uses the base case data. Create a New Tab in your Excel worksheet labelled "Graphs" and place your graph in this tab. Figure 1. NOI and Operating Expense Ratio by Year. Figure 1. NOI and Operating Expense Ratio by Year. 1 4796 1,500,000 NOI and Operating Expense Ratio by Year 1,400,000 459 1,300,000 Net Operating Income -Operating Expense Ratio 1,200,000 41 Operating Expense Ratio 1,100,000 39 1.000.000 For all Suites use a 2.5% Cost Growth Rate. Change the size of Suite A and Suite B to 25000 sq.ft. Suite A: $18 Contract Rent $0 Expense Stop, 3% Rental Growth Rate. Suite B: $28 Contract Rent, $7 Expense Stop, 0% Rental Growth Rate, $33 Rental Rate starting year 7. Suite C: $15 Contract Rent, $o Expense Stop, 3% Rental Growth Rate, 4.5% Sales Growth Rate, 3% of Sales above $3,000,000. Initial Sales estimated at $4,500,000 Suite D: $30 Contract Rent, $99 Expense Stop, 0% Rental Growth Rate, $15,000/yr in Misc Income 1. Create a graph of NOI and Operating Expense Ratio by year using the rents, and vacancies as noted above. The example graph, shown below for illustration, uses the base case data. Create a New Tab in your Excel worksheet labelled "Graphs" and place your graph in this tab. Figure 1. NOI and Operating Expense Ratio by Year. I Figure 1.-NOI and Operating Expense Ratio-byYear. 1 479 1,500,000 NOI and Operating Expense Ratio by Year 1,400,000 45% 1,300,000 -Net Operating Income Operating Expense Ratio 1,200,000 41 NOI Opating tepense Ratio 1.100.000 39 1,000,000 37% 900,000 35% 800,000 3 4 6 8 9 10 thank you so much 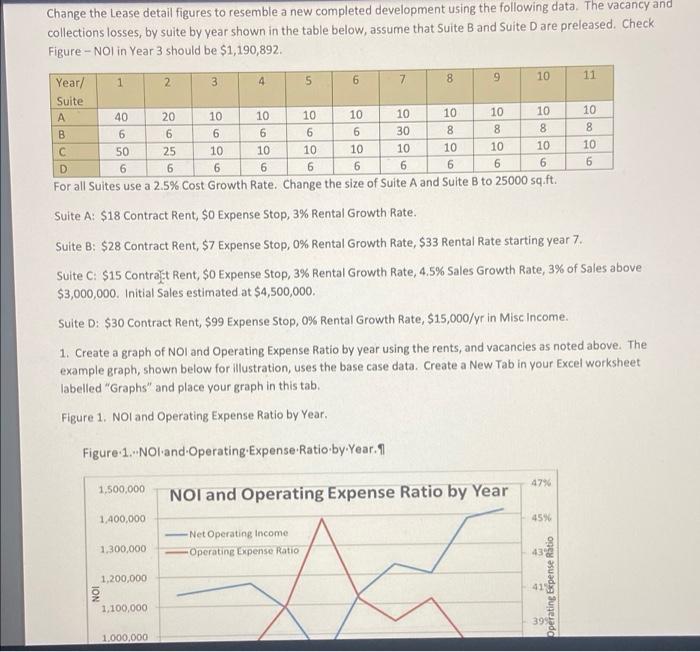
Step by Step Solution
There are 3 Steps involved in it
Step: 1

Get Instant Access to Expert-Tailored Solutions
See step-by-step solutions with expert insights and AI powered tools for academic success
Step: 2

Step: 3
Ace Your Homework with AI
Get the answers you need in no time with our AI-driven, step-by-step assistance
Get Started
Contemporary Conflict Resolution
Authors: Oliver Ramsbotham, Tom Woodhouse, Hugh Miall
3rd Edition
0745649742,1509509542