Answered step by step
Verified Expert Solution
Question
1 Approved Answer
. Please take a look at the proposed infrastructure plan on The White House. Most of items fall into the category of Government consumption

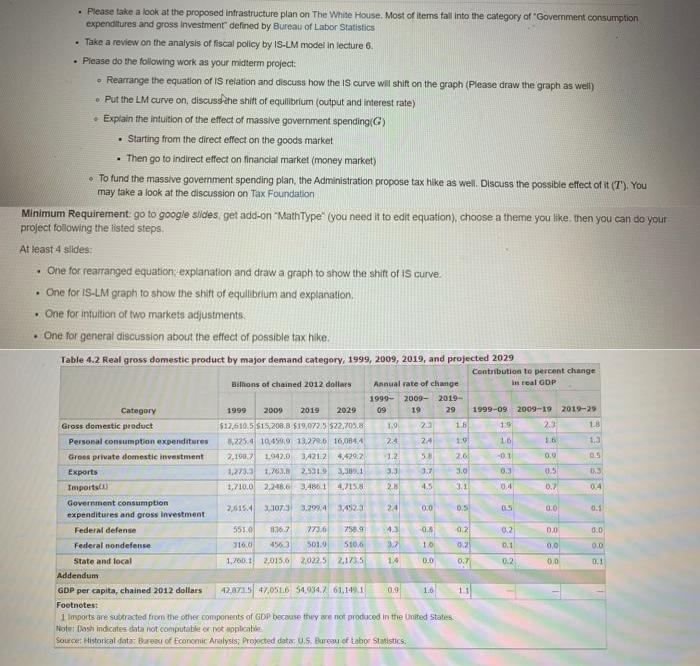
. Please take a look at the proposed infrastructure plan on The White House. Most of items fall into the category of "Government consumption expenditures and gross Investment" defined by Bureau of Labor Statistics Take a review on the analysis of fiscal policy by IS-LM model in lecture 6. . Please do the following work as your midterm project: Rearrange the equation of IS relation and discuss how the IS curve will shift on the graph (Please draw the graph as well) . Put the LM curve on, discuss the shift of equilibrium (output and interest rate) Explain the intuition of the effect of massive government spending (G) Starting from the direct effect on the goods market . Then go to indirect effect on financial market (money market) To fund the massive government spending plan, the Administration propose tax hike as well. Discuss the possible effect of it (7). You may take a look at the discussion on Tax Foundation Minimum Requirement: go to google slides, get add-on "MathType" (you need it to edit equation), choose a theme you like. then you can do your project following the listed steps. At least 4 slides: . One for rearranged equation, explanation and draw a graph to show the shift of IS curve. . One for IS-LM graph to show the shift of equilibrium and explanation. . One for intuition of two markets adjustments. . One for general discussion about the effect of possible tax hike. Table 4.2 Real gross domestic product by major demand category, 1999, 2009, 2019, and projected 2029 Category Gross domestic product Personal consumption expenditures Groes private domestic investment Exports Imports(1) Government consumption expenditures and gross investment Federal defense Federal nondefense State and local Addendum GDP per capita, chained 2012 dollars Billions of chained 2012 dollars 1999 2009 2019 2029 $12,610.5 $15,208.8 $19,072.5 $22.705.8 8,225-4 10,459,9 13,279.6 16,0844 2,100.7 1.942.0 3,421.2 4,429.2 1,273.3 1,763,8 2.531.9 3,389.1 1,710.0 2.246.6 3.486.11 4,7158 Annual rate of change 1999- 2009- 2019- 09 19 29 42.871.5 47,051.6 54,934.7 61.149.1 1.9 24 1.2 3.3 2.8 2,615.4 3,307.3 3.2994 3,492.3 4.3 551.0 136.7 773.6 758.9 316,0 4563 501.9 510,6 3.7 1,760.1 2015.0 2022.5 2,1735 14 24 0.9 2.3 24 5.8 3.7 4.5 8828 9 0.0 -0.5 0.0 Footnotes: 1 Imports are subtracted from the other components of GDP because they are not produced in the United States Note: Dosh indicates data not computable or not applicable Source: Historical data: Bureau of Economic Analysis; Projected data: U.S. Bureau of Labor Statistics. 16 1.9 2.6 3.0 3.1 0.5 -0.2 0.25 0.7 1.1 Contribution to percent change in real GDP 1999-09 19 16 -0.1 0.3 0.4 0.5 0.2 0.1 0.2 2009-19 2019-29 328338 888 0.9 W 1.8 1.3 0.5 6.3 04 0.1 0.0 0.0 0.1
Step by Step Solution
★★★★★
3.55 Rating (165 Votes )
There are 3 Steps involved in it
Step: 1
I understand that youre looking for a detailed analysis of the fiscal policy proposed by the White House using the ISLM model to explain its effects o...
Get Instant Access to Expert-Tailored Solutions
See step-by-step solutions with expert insights and AI powered tools for academic success
Step: 2

Step: 3

Ace Your Homework with AI
Get the answers you need in no time with our AI-driven, step-by-step assistance
Get Started


