

Answered step by step
Verified Expert Solution
Question
1 Approved Answer
please the right answers!!! An experiment is performed where the concentration of acetaldehyde is measured at vari (a) Using Excel (or similar software), graph the
please the right answers!!! 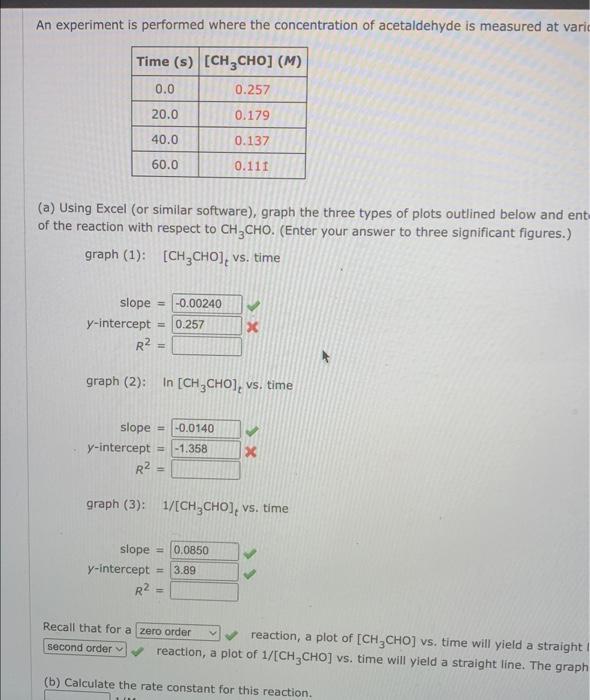
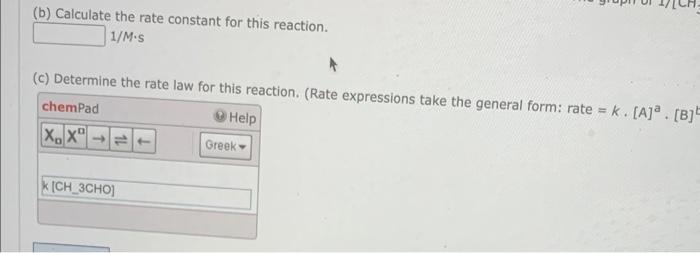
An experiment is performed where the concentration of acetaldehyde is measured at vari (a) Using Excel (or similar software), graph the three types of plots outlined below and ent of the reaction with respect to CH3CHO. (Enter your answer to three significant figures.) graph(1):[CH3CHO]t vs. time graph(2): In [CH3CHO]t vs. time slope=y-intercept=R2=graph(3):slope=y-intercept=R2= graph(3):1/[CH3CHO]t vs. time Recall that for a reaction, a plot of [CH3CHO] vs. time will yield a straight reaction, a plot of 1/[CH3CHO] vs. time will yield a straight line. The graph (b) Calculate the rate constant for this reaction. (b) Calculate the rate constant for this reaction. 1/Ms (c) Determine the rate law for thie rasction. (Rate expressions take the general form: rate =k. [A]a Step by Step Solution
There are 3 Steps involved in it
Step: 1

Get Instant Access to Expert-Tailored Solutions
See step-by-step solutions with expert insights and AI powered tools for academic success
Step: 2

Step: 3
Ace Your Homework with AI
Get the answers you need in no time with our AI-driven, step-by-step assistance
Get Started
Chemistry A Molecular Approach
Authors: Nivaldo J. Tro
4th edition
134112830, 978-0134112831