

Answered step by step
Verified Expert Solution
Question
1 Approved Answer
Please try to answer every part. Thank you! This is all the info needed for this assignment. The Board of Governors of the Federal Reserve
 Please try to answer every part. Thank you!
This is all the info needed for this assignment.
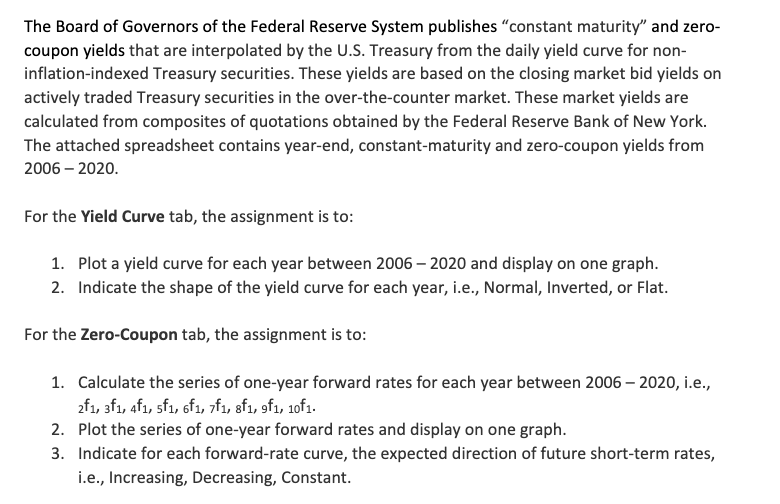
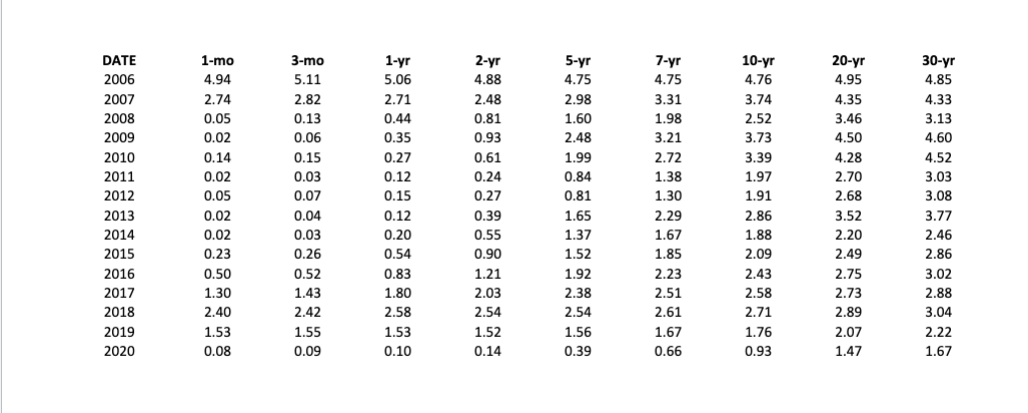
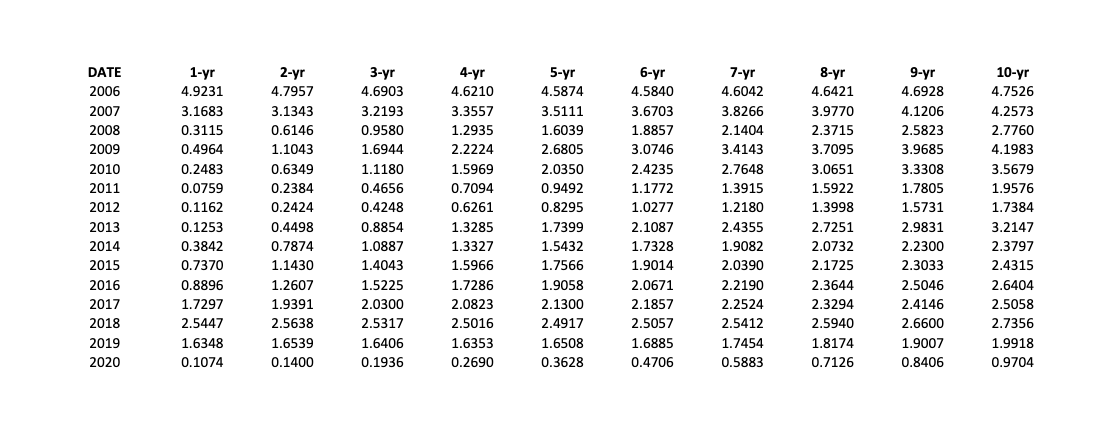
The Board of Governors of the Federal Reserve System publishes constant maturity" and zero- coupon yields that are interpolated by the U.S. Treasury from the daily yield curve for non- inflation-indexed Treasury securities. These yields are based on the closing market bid yields on actively traded Treasury securities in the over-the-counter market. These market yields are calculated from composites of quotations obtained by the Federal Reserve Bank of New York. The attached spreadsheet contains year-end, constant-maturity and zero-coupon yields from 2006 2020. For the Yield Curve tab, the assignment is to: 1. Plot a yield curve for each year between 2006 2020 and display on one graph. 2. Indicate the shape of the yield curve for each year, i.e., Normal, Inverted, or Flat. For the Zero-Coupon tab, the assignment is to: 1. Calculate the series of one-year forward rates for each year between 2006 2020, i.e., 2f1, 3f1, 4f1, sf1, 6f1, 7f1, 8f1, 9f1, 10f1. 2. Plot the series of one-year forward rates and display on one graph. 3. Indicate for each forward-rate curve, the expected direction of future short-term rates, i.e., Increasing, Decreasing, Constant. DATE 2006 2007 2008 2009 2010 2011 2012 2013 2014 2015 2016 2017 2018 2019 2020 1-mo 4.94 2.74 0.05 0.02 0.14 0.02 0.05 0.02 0.02 0.23 0.50 1.30 2.40 1.53 0.08 3-mo 5.11 2.82 0.13 0.06 0.15 0.03 0.07 0.04 0.03 0.26 0.52 1.43 2.42 1.55 0.09 1-yr 5.06 2.71 0.44 0.35 0.27 0.12 0.15 0.12 0.20 0.54 2-yr 4.88 2.48 0.81 0.93 0.61 0.24 0.27 0.39 0.55 0.90 1.21 2.03 2.54 1.52 0.14 5-yr 4.75 2.98 1.60 2.48 1.99 0.84 0.81 1.65 1.37 1.52 1.92 2.38 2.54 1.56 0.39 7-yr 4.75 3.31 1.98 3.21 2.72 1.38 1.30 2.29 1.67 1.85 2.23 2.51 2.61 1.67 0.66 10-yr 4.76 3.74 2.52 3.73 3.39 1.97 1.91 2.86 1.88 2.09 2.43 2.58 2.71 1.76 0.93 20-yr 4.95 4.35 3.46 4.50 4.28 2.70 2.68 3.52 2.20 2.49 2.75 2.73 2.89 2.07 1.47 30-yr 4.85 4.33 3.13 4.60 4.52 3.03 3.08 3.77 2.46 2.86 3.02 2.88 3.04 2.22 1.67 0.83 1.80 2.58 1.53 0.10 DATE 2006 2007 2008 2009 2010 2011 2012 2013 2014 2015 2016 2017 2018 2019 2020 1-yr - 4.9231 3.1683 0.3115 0.4964 0.2483 0.0759 0.1162 0.1253 0.3842 0.7370 0.8896 1.7297 2.5447 1.6348 0.1074 2-yr 4.7957 3.1343 0.6146 1.1043 0.6349 0.2384 0.2424 0.4498 0.7874 1.1430 1.2607 1.9391 2.5638 1.6539 0.1400 3-yr 4.6903 3.2193 0.9580 1.6944 1.1180 0.4656 0.4248 0.8854 1.0887 1.4043 1.5225 2.0300 2.5317 1.6406 0.1936 4-yr 4.6210 3.3557 1.2935 2.2224 1.5969 0.7094 0.6261 1.3285 1.3327 1.5966 1.7286 2.0823 2.5016 1.6353 0.2690 5-yr 4.5874 3.5111 1.6039 2.6805 2.0350 0.9492 0.8295 1.7399 1.5432 1.7566 1.9058 2.1300 2.4917 1.6508 0.3628 6-yr 4.5840 3.6703 1.8857 3.0746 2.4235 1.1772 1.0277 2.1087 1.7328 1.9014 2.0671 2.1857 2.5057 1.6885 0.4706 7-yr 4.6042 3.8266 2.1404 3.4143 2.7648 1.3915 1.2180 2.4355 1.9082 2.0390 2.2190 2.2524 2.5412 1.7454 0.5883 8-yr 4.6421 3.9770 2.3715 3.7095 3.0651 1.5922 1.3998 2.7251 2.0732 2.1725 2.3644 2.3294 2.5940 1.8174 0.7126 9-yr 4.6928 4.1206 2.5823 3.9685 3.3308 1.7805 1.5731 2.9831 2.2300 2.3033 2.5046 2.4146 2.6600 1.9007 0.8406 10-yr 4.7526 4.2573 2.7760 4.1983 3.5679 1.9576 1.7384 3.2147 2.3797 2.4315 2.6404 2.5058 2.7356 1.9918 0.9704 The Board of Governors of the Federal Reserve System publishes constant maturity" and zero- coupon yields that are interpolated by the U.S. Treasury from the daily yield curve for non- inflation-indexed Treasury securities. These yields are based on the closing market bid yields on actively traded Treasury securities in the over-the-counter market. These market yields are calculated from composites of quotations obtained by the Federal Reserve Bank of New York. The attached spreadsheet contains year-end, constant-maturity and zero-coupon yields from 2006 2020. For the Yield Curve tab, the assignment is to: 1. Plot a yield curve for each year between 2006 2020 and display on one graph. 2. Indicate the shape of the yield curve for each year, i.e., Normal, Inverted, or Flat. For the Zero-Coupon tab, the assignment is to: 1. Calculate the series of one-year forward rates for each year between 2006 2020, i.e., 2f1, 3f1, 4f1, sf1, 6f1, 7f1, 8f1, 9f1, 10f1. 2. Plot the series of one-year forward rates and display on one graph. 3. Indicate for each forward-rate curve, the expected direction of future short-term rates, i.e., Increasing, Decreasing, Constant. DATE 2006 2007 2008 2009 2010 2011 2012 2013 2014 2015 2016 2017 2018 2019 2020 1-mo 4.94 2.74 0.05 0.02 0.14 0.02 0.05 0.02 0.02 0.23 0.50 1.30 2.40 1.53 0.08 3-mo 5.11 2.82 0.13 0.06 0.15 0.03 0.07 0.04 0.03 0.26 0.52 1.43 2.42 1.55 0.09 1-yr 5.06 2.71 0.44 0.35 0.27 0.12 0.15 0.12 0.20 0.54 2-yr 4.88 2.48 0.81 0.93 0.61 0.24 0.27 0.39 0.55 0.90 1.21 2.03 2.54 1.52 0.14 5-yr 4.75 2.98 1.60 2.48 1.99 0.84 0.81 1.65 1.37 1.52 1.92 2.38 2.54 1.56 0.39 7-yr 4.75 3.31 1.98 3.21 2.72 1.38 1.30 2.29 1.67 1.85 2.23 2.51 2.61 1.67 0.66 10-yr 4.76 3.74 2.52 3.73 3.39 1.97 1.91 2.86 1.88 2.09 2.43 2.58 2.71 1.76 0.93 20-yr 4.95 4.35 3.46 4.50 4.28 2.70 2.68 3.52 2.20 2.49 2.75 2.73 2.89 2.07 1.47 30-yr 4.85 4.33 3.13 4.60 4.52 3.03 3.08 3.77 2.46 2.86 3.02 2.88 3.04 2.22 1.67 0.83 1.80 2.58 1.53 0.10 DATE 2006 2007 2008 2009 2010 2011 2012 2013 2014 2015 2016 2017 2018 2019 2020 1-yr - 4.9231 3.1683 0.3115 0.4964 0.2483 0.0759 0.1162 0.1253 0.3842 0.7370 0.8896 1.7297 2.5447 1.6348 0.1074 2-yr 4.7957 3.1343 0.6146 1.1043 0.6349 0.2384 0.2424 0.4498 0.7874 1.1430 1.2607 1.9391 2.5638 1.6539 0.1400 3-yr 4.6903 3.2193 0.9580 1.6944 1.1180 0.4656 0.4248 0.8854 1.0887 1.4043 1.5225 2.0300 2.5317 1.6406 0.1936 4-yr 4.6210 3.3557 1.2935 2.2224 1.5969 0.7094 0.6261 1.3285 1.3327 1.5966 1.7286 2.0823 2.5016 1.6353 0.2690 5-yr 4.5874 3.5111 1.6039 2.6805 2.0350 0.9492 0.8295 1.7399 1.5432 1.7566 1.9058 2.1300 2.4917 1.6508 0.3628 6-yr 4.5840 3.6703 1.8857 3.0746 2.4235 1.1772 1.0277 2.1087 1.7328 1.9014 2.0671 2.1857 2.5057 1.6885 0.4706 7-yr 4.6042 3.8266 2.1404 3.4143 2.7648 1.3915 1.2180 2.4355 1.9082 2.0390 2.2190 2.2524 2.5412 1.7454 0.5883 8-yr 4.6421 3.9770 2.3715 3.7095 3.0651 1.5922 1.3998 2.7251 2.0732 2.1725 2.3644 2.3294 2.5940 1.8174 0.7126 9-yr 4.6928 4.1206 2.5823 3.9685 3.3308 1.7805 1.5731 2.9831 2.2300 2.3033 2.5046 2.4146 2.6600 1.9007 0.8406 10-yr 4.7526 4.2573 2.7760 4.1983 3.5679 1.9576 1.7384 3.2147 2.3797 2.4315 2.6404 2.5058 2.7356 1.9918 0.9704Step by Step Solution
There are 3 Steps involved in it
Step: 1

Get Instant Access to Expert-Tailored Solutions
See step-by-step solutions with expert insights and AI powered tools for academic success
Step: 2

Step: 3
Ace Your Homework with AI
Get the answers you need in no time with our AI-driven, step-by-step assistance
Get Started
Securities Trader Qualification Examination Series 57 Study Guide
Authors: Philip Martin Mccaulay
1st Edition
979-8363665240