

Answered step by step
Verified Expert Solution
Question
1 Approved Answer
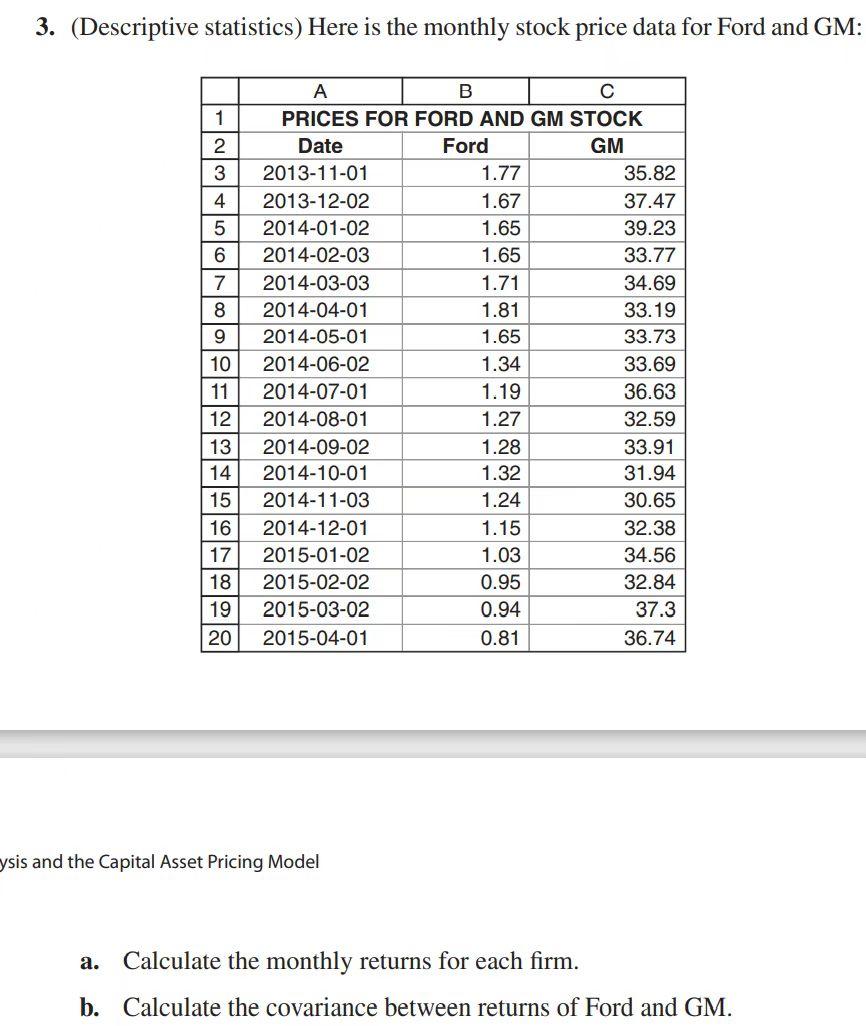
Please use Excel and show formulas and work, thank you! 3. (Descriptive statistics) Here is the monthly stock price data for Ford and GM: A
Please use Excel and show formulas and work, thank you!
3. (Descriptive statistics) Here is the monthly stock price data for Ford and GM: A B C 1 PRICES FOR FORD AND GM STOCK 2 Date Ford GM 3 2013-11-01 1.77 35.82 4 2013-12-02 1.67 37.47 5 2014-01-02 1.65 39.23 6 2014-02-03 1.65 33.77 7 2014-03-03 1.71 34.69 8 2014-04-01 1.81 33.19 9 2014-05-01 1.65 33.73 10 2014-06-02 1.34 33.69 11 2014-07-01 1.19 36.63 12 2014-08-01 1.27 32.59 13 2014-09-02 1.28 33.91 14 2014-10-01 1.32 31.94 2014-11-03 1.24 30.65 15 16 2014-12-01 1.15 32.38 17 2015-01-02 1.03 34.56 18 2015-02-02 0.95 32.84 19 2015-03-02 0.94 37.3 20 2015-04-01 0.81 36.74 ysis and the Capital Asset Pricing Model a. Calculate the monthly returns for each firm. b. Calculate the covariance between returns of Ford and GMStep by Step Solution
There are 3 Steps involved in it
Step: 1

Get Instant Access to Expert-Tailored Solutions
See step-by-step solutions with expert insights and AI powered tools for academic success
Step: 2

Step: 3
Ace Your Homework with AI
Get the answers you need in no time with our AI-driven, step-by-step assistance
Get Started
Competitor Analysis In Financial Services
Authors: Ian Youngman
1st Edition
1855733315,1782420053