Please, use Excel and show your calculations!
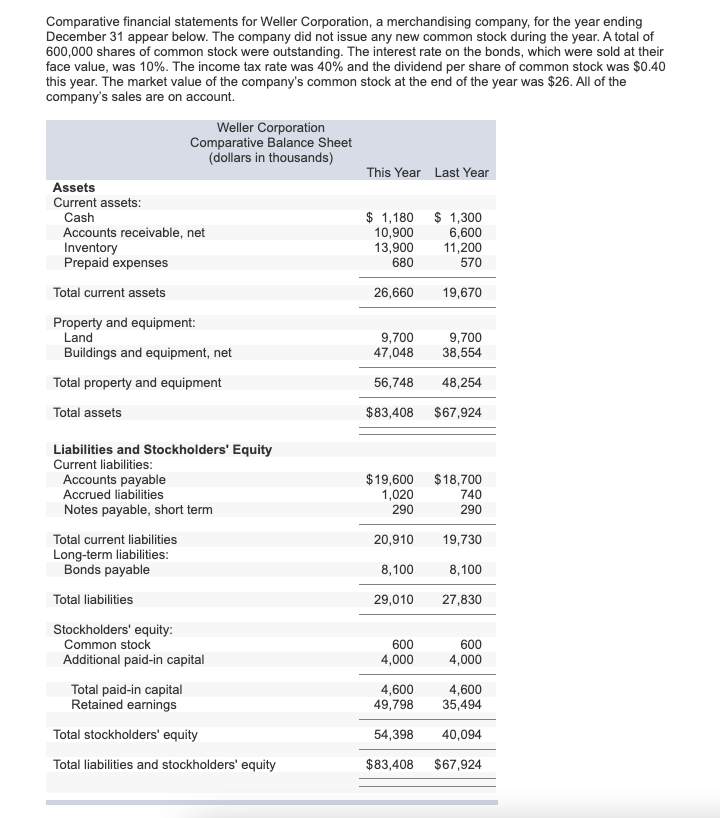
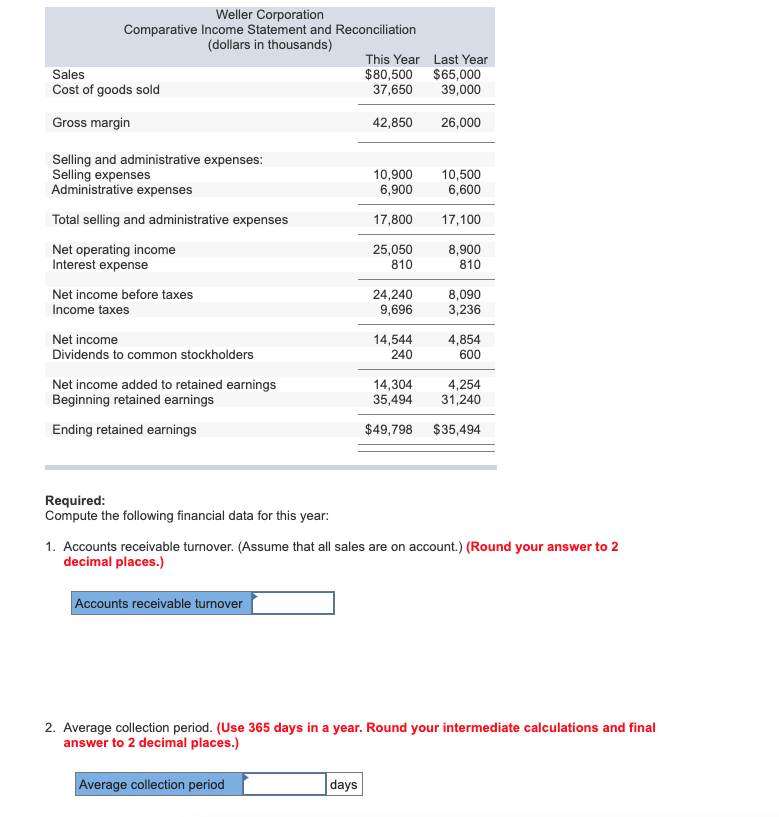

Comparative financial statements for Weller Corporation, a merchandising company, for the year ending December 31 appear below. The company did not issue any new common stock during the year. A total of 600,000 shares of common stock were outstanding. The interest rate on the bonds, which were sold at their face value, was 10%. The income tax rate was 40% and the dividend per share of common stock was $0.40 this year. The market value of the company's common stock at the end of the year was $26. All of the company's sales are on account. Weller Corporation Comparative Balance Sheet (dollars in thousands) This Year Last Year Assets Current assets: Cash Accounts receivable, net Inventory Prepaid expenses Total current assets $ 1,180 10,900 13,900 680 $ 1,300 6,600 11,200 570 26,660 19,670 Property and equipment: Land Buildings and equipment, net Total property and equipment 9,700 47,048 9,700 38,554 56,748 48,254 Total assets $83,408 $67,924 $19,600 1,020 290 $18,700 740 290 Liabilities and Stockholders' Equity Current liabilities: Accounts payable Accrued liabilities Notes payable, short term Total current liabilities Long-term liabilities: Bonds payable Total liabilities 20,910 19,730 8,100 8,100 29,010 27,830 Stockholders' equity: Common stock Additional paid-in capital Total paid-in capital Retained earnings 600 4,000 600 4,000 4,600 49,798 4,600 35,494 Total stockholders' equity 54,398 40,094 Total liabilities and stockholders' equity $83,408 $67,924 Weller Corporation Comparative Income Statement and Reconciliation (dollars in thousands) This Year Last Year Sales $80,500 $65,000 Cost of goods sold 37,650 39,000 Gross margin 42,850 26,000 Selling and administrative expenses: Selling expenses Administrative expenses 10,900 6,900 10,500 6,600 17,800 17,100 25,050 810 8,900 810 Total selling and administrative expenses Net operating income Interest expense Net income before taxes Income taxes Net income Dividends to common stockholders 24,240 9,696 8,090 3,236 14,544 240 4,854 600 14,304 35,494 4,254 31,240 Net income added to retained earnings Beginning retained earnings Ending retained earnings $49,798 $35,494 Required: Compute the following financial data for this year: 1. Accounts receivable turnover. (Assume that all sales are on account.) (Round your answer to 2 decimal places.) Accounts receivable turnover 2. Average collection period. (Use 365 days in a year. Round your intermediate calculations and final answer to 2 decimal places.) Average collection period days 3. Inventory turnover. (Round your answer to 2 decimal places.) Inventory turnover Average sale period. (Use 365 days in a year. Round your intermediate calculations and answer to 2 decimal places.) Average sale period days 5. Operating cycle. (Round your intermediate calculations and final answer to 2 decimal places.) Operating cycle days 6. Total asset turnover. (Round your answer to 2 decimal places.) Total asset turnover