

Answered step by step
Verified Expert Solution
Question
1 Approved Answer
please use excel & answer both questions- will upvote if they are correct Question1: question 2: The accompanying dataset provides data on the monthly usage
please use excel & answer both questions- will upvote if they are correct Question1: 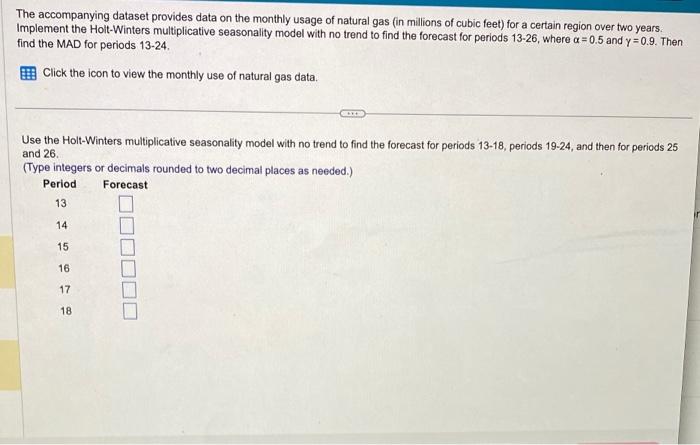
 question 2:
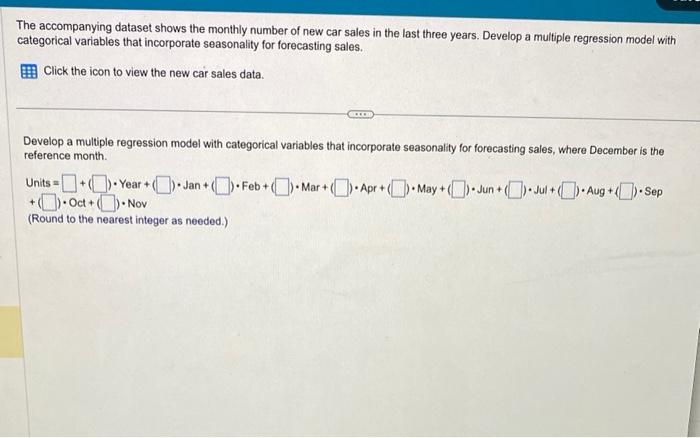
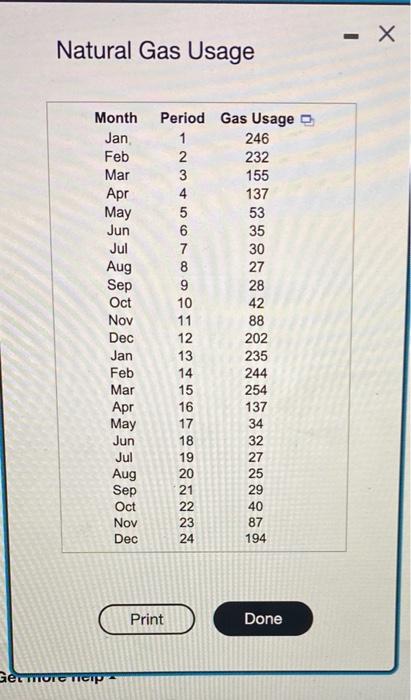
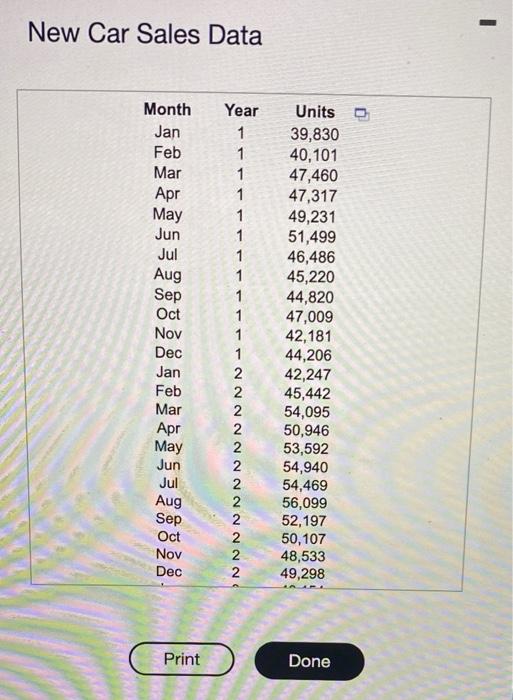 The accompanying dataset provides data on the monthly usage of natural gas (in millions of cubic feet) for a certain region over two years. Implement the Holt-Winters multiplicative seasonality model with no trend to find the forecast for periods 1326, where =0.5 and =0.9. Then find the MAD for periods 13-24. Click the icon to view the monthly use of natural gas data. Use the Holt-Winters multiplicative seasonality model with no trend to find the forecast for periods 13-18, periods 19-24, and then for periods 25 and 26. (Type integers or decimals rounded to two decimal places as needed.) Natural Gas Usage The accompanying dataset shows the monthly number of new car sales in the last three years. Develop a multiple regression model with categorical variables that incorporate seasonality for forecasting sales. Click the icon to view the new car sales data. Develop a multiple regression model with categorical variables that incorporate seasonality for forecasting sales, where December is the reference month. Units=+(1Year+11Jan+11Feb+11Mar+11Apr+11May+11Jun+11Jul+11Aug+11Sep+11Oct+1)Nov (Round to the nearest integer as needed.) New Car Sales Data The accompanying dataset provides data on the monthly usage of natural gas (in millions of cubic feet) for a certain region over two years. Implement the Holt-Winters multiplicative seasonality model with no trend to find the forecast for periods 1326, where =0.5 and =0.9. Then find the MAD for periods 13-24. Click the icon to view the monthly use of natural gas data. Use the Holt-Winters multiplicative seasonality model with no trend to find the forecast for periods 13-18, periods 19-24, and then for periods 25 and 26. (Type integers or decimals rounded to two decimal places as needed.) Natural Gas Usage The accompanying dataset shows the monthly number of new car sales in the last three years. Develop a multiple regression model with categorical variables that incorporate seasonality for forecasting sales. Click the icon to view the new car sales data. Develop a multiple regression model with categorical variables that incorporate seasonality for forecasting sales, where December is the reference month. Units=+(1Year+11Jan+11Feb+11Mar+11Apr+11May+11Jun+11Jul+11Aug+11Sep+11Oct+1)Nov (Round to the nearest integer as needed.) New Car Sales Data
Question1:
question 2:
Step by Step Solution
There are 3 Steps involved in it
Step: 1

Get Instant Access to Expert-Tailored Solutions
See step-by-step solutions with expert insights and AI powered tools for academic success
Step: 2

Step: 3
Ace Your Homework with AI
Get the answers you need in no time with our AI-driven, step-by-step assistance
Get Started
Risk Management In Forex How To Minimize Losses And Maximize Returns
Authors: Eunice Loar
1st Edition
979-8388778864