Please use Excel cell formulas and functions to compute answers to these questions in your spreadsheet. PLEASE SHOW EXCEL FORMULAS AND COMPLETE USING EXCEL!
Free Cash Flow Calculation: Calculate Target and Walmart companys Free Cash Flow for each of the last 4 fiscal years. Use a tax rate of 25% and use the depreciation and amortization from the Cash Flow statement.
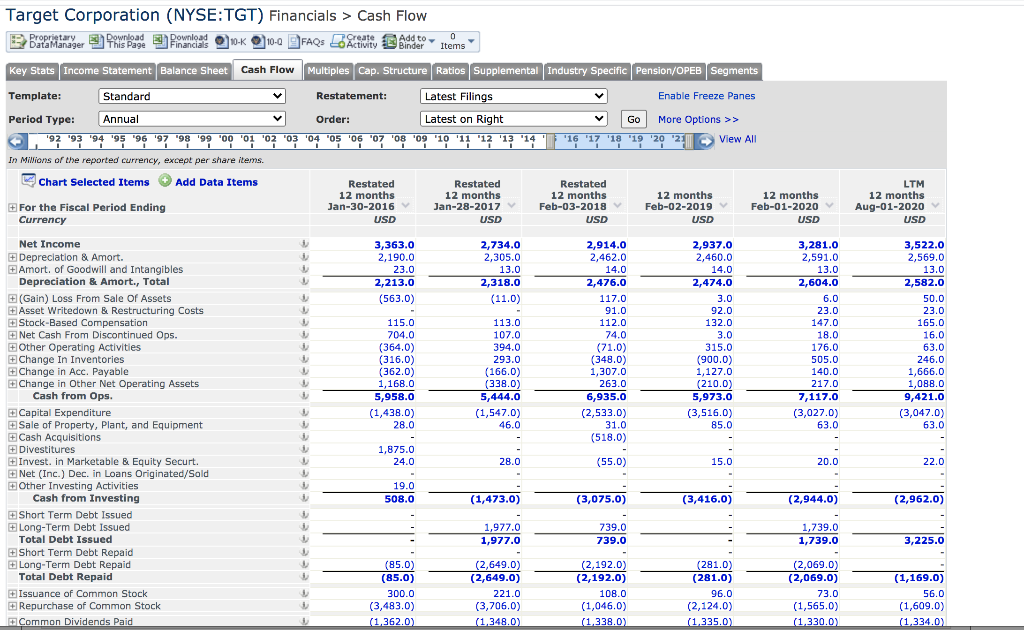
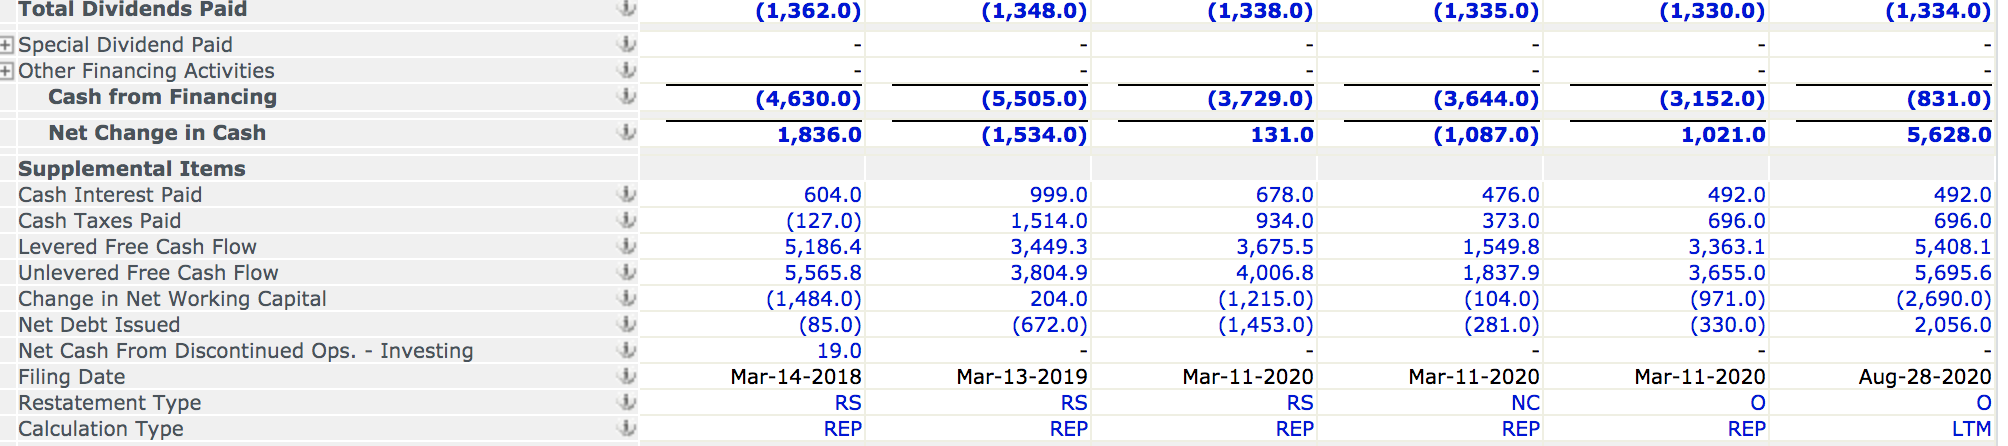
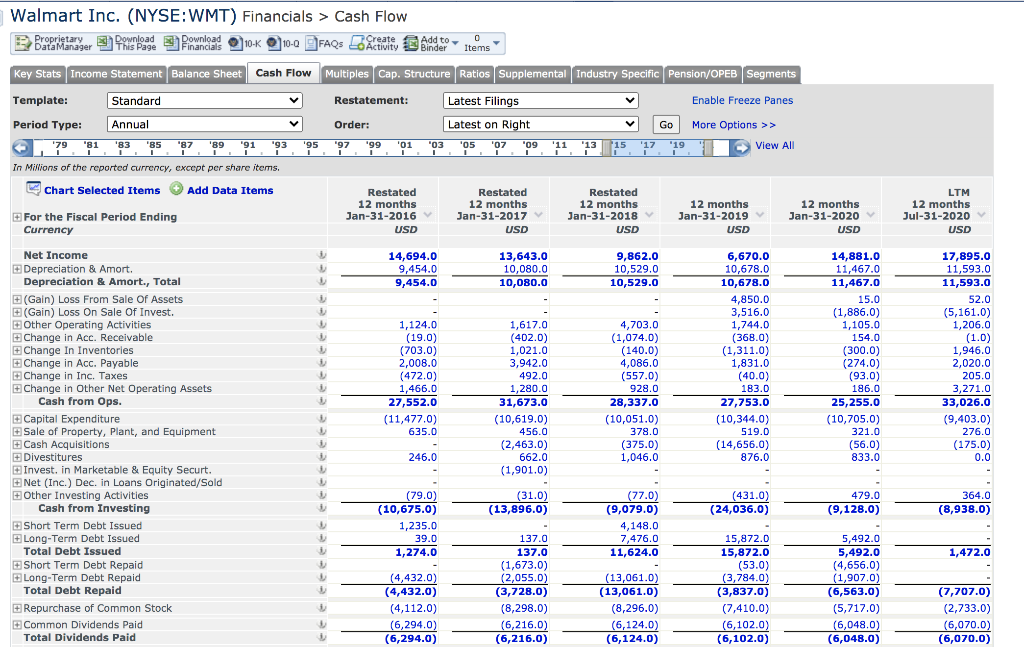
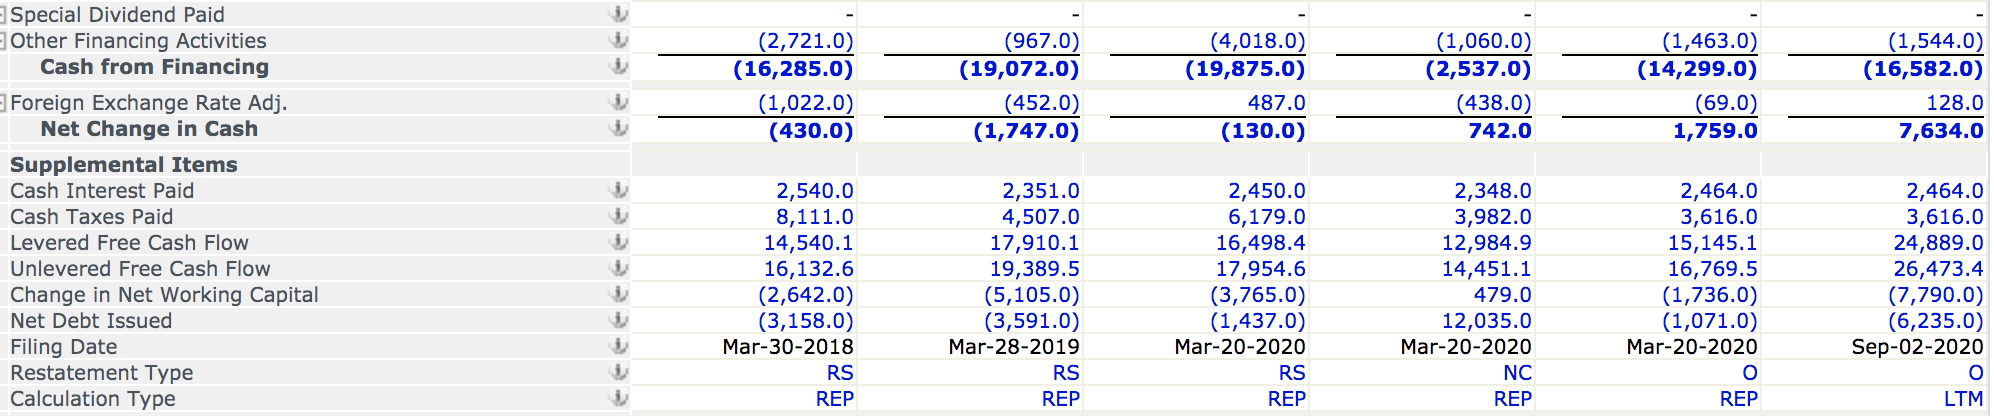
Target Corporation (NYSE:TGT) Financials > Cash Flow B Broprietary Download This Page Pinancias 0-0-0 EFAQs Activity and FAQs Add to Items Key Stats Income Statement Balance Sheet Cash Flow Multiples Cap. Structure Ratios Supplemental Industry Specific Pension/OPEB Segments Template: Standard Restatement: Latest Filings Enable Freeze Panes Period Type: Annual Order: Latest on Right Go More Options >> '92 93 94 95 96 97 98 99 00 01 02 03 04 05 06 07 08 09 10 11 12 13 14 ''16 '17 '18 '19 20 21 View All In Millions of the reported currency, except per share items. Chart Selected Items Add Data Items Restated Restated Restated 12 months 12 months 12 months 12 months 12 months For the Fiscal Period Ending Jan-30-2016 Jan-28-2017 Feb-03-2018 Feb-02-2019 Feb-01-2020 Currency USD USD USD USD USD V LTM 12 months Aug-01-2020 USD 3,363.0 2,190.0 23.0 2,213.0 (563.0) 2,734.0 2,305.0 13.0 2,318.0 (11.0) 115.0 704.0 (364.0) (316.0) (362.0) 1,168.0 5,958.0 (1,438.0) 28.0 113.0 107.0 394.0 293.0 (166.0) (338.0) 5,444.0 (1,547,0) 46.0 2,914.0 2,462.0 14.0 2,476.0 117.0 91.0 112.0 74.0 (71.0) (348.0) 1,307.0 263.0 6,935.0 (2,533.0) 31.0 (518.0) 2,937.0 2,460.0 14.0 2,474.0 3.0 92.0 132.0 3.0 315.0 (900.0) 1,127.0 (210.0) 5,973.0 (3,516.0) 85.0 3,522.0 2,569.0 13.0 2,582.0 50.0 23.0 165.0 16.0 63.0 246.0 1,666.0 1,088.0 3,281.0 2,591.0 13.0 2,604.0 6.0 23.0 147.0 18.0 176.0 505.0 140.0 217.0 7,117.0 (3,027.0) 63.0 9,421.0 Net Income Depreciation & Amort. Amort. of Goodwill and Intangibles Depreciation & Amort., Total (Gain) Loss From Sale Of Assets Asset Writedown & Restructuring Costs Stock-Based Compensation Net Cash From Discontinued Ops. Other Operating Activities + Change In Inventories Change in Acc. Payable Change in Other Net Operating Assets Cash from Ops. Capital Expenditure Sale of Property, Plant, and Equipment Cash Acquisitions Divestitures Invest. in Marketable & Equity Securt. Net (Inc.) Dec. in Loans Originated/Sold Other Investing Activities Cash from Investing Short Term Debt Issued Long-Term Debt Issued Total Debt Issued Short Term Debt Repaid Long-Term Debt Repaid Total Debt Repaid Issuance of Common Stock Repurchase of Common Stock Common Dividends Paid (3,047.0) 63.0 u 1,875.0 24.0 28.0 28.0 (55.0) 15.0 20.0 22.0 19.0 508.0 (1,473.0) (3,075.0) (3,416.0) (2,944.0) (2,962.0) 1,977.0 1,977.0 739.0 739.0 1,739.0 1,739.0 3,225.0 (85.0) (85.0) 300.0 (3,483.0) (1,362.0) (2,649.0) (2,649.0) 221.0 (3,706.0) (1.348.0 (2,192.0) (2,192.0) 108.0 (1,046.0) (1,338.0) (281.0) (281.0) 96.0 (2,124.0) (1,335.0) (2,069.0) (2,069.0) 73.0 (1,565.0) (1,330.0) (1,169.0) 56.0 (1,609.0) (1.334.0) (1,362.0) (1,348.0) (1,338.0) (1,335.0) (1,330.0) (1,334.0) (4,630.0) 1,836.0 (5,505.0) (1,534.0) (3,729.0 131.0 (3,644.0) (1,087.0) (3,152.0) 1,021.0 (831.0) 5,628.0 i Total Dividends Paid + Special Dividend Paid + Other Financing Activities Cash from Financing Net Change in Cash Supplemental Items Cash Interest Paid Cash Taxes Paid Levered Free Cash Flow Unlevered Free Cash Flow Change in Net Working Capital Net Debt Issued Net Cash From Discontinued Ops. - Investing Filing Date Restatement Type Calculation Type 604.0 (127.0) 5,186.4 5,565.8 (1,484.0) (85.0) 19.0 Mar-14-2018 RS REP 999.0 1,514.0 3,449.3 3,804.9 204.0 (672.0) 678.0 934.0 3,675.5 4,006.8 (1,215.0) (1,453.0) 476.0 373.0 1,549.8 1,837.9 (104.0) (281.0) 492.0 696.0 3,363.1 3,655.0 (971.0) (330.0) 492.0 696.0 5,408.1 5,695.6 (2,690.0) 2,056.0 Mar-13-2019 RS REP Mar-11-2020 RS REP Mar-11-2020 NC REP Mar-11-2020 O REP Aug-28-2020 O LTM Proprietary Download Create 0 Walmart Inc. (NYSE:WMT) Financials > Cash Flow B Bata Manager Pinancials 10-10-0 EFAQs Acidity linder Items Key Stats Income Statement Balance Sheet Cash Flow Cash Flow Multiples Cap. Structure Ratios Supplemental Industry Specific Pension/OPEB Segments Restatement: Latest Filings Enable Freeze Panes Order: Go Template: Standard Period Type: Annual 79 81 85 "87 '89 '91 '93 19 1 1 In Millions of the reported currency, except per share items. Chart Selected Items Add Data Items Latest on Right "03 '05 '07 07 '09 More Options >> 17 "19" View All 83 "97 '01 '95 1 '99 1 24 '13 11 15 Restated 12 months Jan-31-2016 USD Restated 12 months Jan-31-2017 USD Restated 12 months Jan-31-2018 USD 12 months Jan-31-2019 USD For the Fiscal Period Ending LTM 12 months Jul-31-2020 USD 12 months Jan-31-2020 USD Currency 14,694.0 9,454.0 9,454.0 13,643.0 10,080.0 10,080.0 9,862.0 10,529.0 10,529.0 1,124.0 (19.0) (703.0) 2,008.0 (472.0) 1,466.0 27,552.0 (11,477.0) 635.0 Net Income Depreciation & Amort. Depreciation & Amort., Total (Gain) Loss From Sale Of Assets (Gain) Loss On Sale Of Invest. Other Operating Activities Change in Acc. Receivable Change In Inventories Change in Acc. Payable Change in Inc. Taxes Change in Other Net Operating Assets Cash from Ops. Capital Expenditure Sale of Property, plant, and Equipment Cash Acquisitions Divestitures Invest. in Marketable & Equity Securt. Net (Inc.) Dec. in Loans Originated/Sold Other Investing Activities Cash from Investing Short Term Debt Issued Long-Term Debt Issued Total Debt Issued Short Term Debt Repaid Long-Term Debt Repaid Total Debt Repaid Repurchase of Common Stock Common Dividends Paid Total Dividends Paid 1,617.0 (402.0) 1,021.0 3,942.0 492.0 1,280.0 31,673.0 (10,619.0) 456.0 (2,463.0) 662.0 (1,901.0) U 6,670.0 10,678.0 10,678.0 4,850.0 3,516.0 1,744.0 (368.0) (1,311.0) 1,831.0 (40.0) 183.0 27,753.0 (10,344.0) 519.0 (14,656.0) 876.0 4,703.0 (1,074.0) (140.0) 4,086.0 (557.0) 928.0 28,337.0 (10,051.0) 378.0 (375.0) 1,046.0 14,881.0 11,467.0 11,467.0 15.0 (1,886.0) 1,105.0 154.0 (300.0) (274.0) (93.0) 186.0 25,255.0 (10,705.0) 321.0 (56.0) 833.0 17,895.0 11,593.0 11,593.0 52.0 (5,161.0) 1,206.0 (1.0) 1,946.0 2,020.0 205.0 3,271.0 33,026.0 (9,403.0) 276.0 (175.0) 0.0 246.0 (31.0) (13,896.0) (431.0) (24,036.0) 479.0 (9,128.0) 364.0 (8,938.0) (79.0) ) (10,675.0) 1,235.0 39.0 1,274.0 (77.0) (9,079.0) 4,148.0 7,476.0 11,624.0 1,472.0 (4,432.0) (4,432.0) (4,112.0) (6,294.0) (6,294.0) 137.0 137.0 (1,673.0) (2,055.0) (3,728.0) (8,298.0) (6,216.0) (6,216.0) (13,061.0) (13,061.0) (8,296.0) (6,124.0) (6,124.0) 15,872.0 15,872.0 (53.0) (3,784.0) (3,837.0) (7,410.0) (6,102.0) (6,102.0) 5,492.0 5,492.0 (4,656.0) (1,907.0) (6,563.0) (5,717,0) (6,048.0) (6,048.0) (7,707.0) (2,733.0) ) (6,070.0) (6,070.0) i (2,721.0) (16,285.0) (1,022.0) (430.0) (967.0) (19,072.0) (452.0) (1,747.0) (4,018.0) (19,875.0) 487.0 (130.0) (1,060.0) (2,537.0) (438.0) 742.0 (1,463.0) (14,299.0) (69.0) 1,759.0 (1,544.0) (16,582.0) 128.0 7,634.0 i i i Special Dividend Paid Other Financing Activities Cash from Financing Foreign Exchange Rate Adj. Net Change in Cash Supplemental Items Cash Interest Paid Cash Taxes Paid Levered Free Cash Flow Unlevered Free Cash Flow Change in Net Working Capital Net Debt Issued Filing Date Restatement Type Calculation Type 2,540.0 8,111.0 14,540.1 16,132.6 (2,642.0) (3,158.0) Mar-30-2018 RS REP 2,351.0 4,507.0 17,910.1 19,389.5 (5,105.0) (3,591.0) Mar-28-2019 RS REP 2,450.0 6,179.0 16,498.4 17,954.6 (3,765.0) (1,437.0) Mar-20-2020 RS REP 2,348.0 3,982.0 12,984.9 14,451.1 479.0 12,035.0 Mar-20-2020 NC REP 2,464.0 3,616.0 15,145.1 16,769.5 (1,736.0) (1,071.0) Mar-20-2020 O REP 2,464.0 3,616.0 24,889.0 26,473.4 (7,790.0) (6,235.0) Sep-02-2020 O LTM Target Corporation (NYSE:TGT) Financials > Cash Flow B Broprietary Download This Page Pinancias 0-0-0 EFAQs Activity and FAQs Add to Items Key Stats Income Statement Balance Sheet Cash Flow Multiples Cap. Structure Ratios Supplemental Industry Specific Pension/OPEB Segments Template: Standard Restatement: Latest Filings Enable Freeze Panes Period Type: Annual Order: Latest on Right Go More Options >> '92 93 94 95 96 97 98 99 00 01 02 03 04 05 06 07 08 09 10 11 12 13 14 ''16 '17 '18 '19 20 21 View All In Millions of the reported currency, except per share items. Chart Selected Items Add Data Items Restated Restated Restated 12 months 12 months 12 months 12 months 12 months For the Fiscal Period Ending Jan-30-2016 Jan-28-2017 Feb-03-2018 Feb-02-2019 Feb-01-2020 Currency USD USD USD USD USD V LTM 12 months Aug-01-2020 USD 3,363.0 2,190.0 23.0 2,213.0 (563.0) 2,734.0 2,305.0 13.0 2,318.0 (11.0) 115.0 704.0 (364.0) (316.0) (362.0) 1,168.0 5,958.0 (1,438.0) 28.0 113.0 107.0 394.0 293.0 (166.0) (338.0) 5,444.0 (1,547,0) 46.0 2,914.0 2,462.0 14.0 2,476.0 117.0 91.0 112.0 74.0 (71.0) (348.0) 1,307.0 263.0 6,935.0 (2,533.0) 31.0 (518.0) 2,937.0 2,460.0 14.0 2,474.0 3.0 92.0 132.0 3.0 315.0 (900.0) 1,127.0 (210.0) 5,973.0 (3,516.0) 85.0 3,522.0 2,569.0 13.0 2,582.0 50.0 23.0 165.0 16.0 63.0 246.0 1,666.0 1,088.0 3,281.0 2,591.0 13.0 2,604.0 6.0 23.0 147.0 18.0 176.0 505.0 140.0 217.0 7,117.0 (3,027.0) 63.0 9,421.0 Net Income Depreciation & Amort. Amort. of Goodwill and Intangibles Depreciation & Amort., Total (Gain) Loss From Sale Of Assets Asset Writedown & Restructuring Costs Stock-Based Compensation Net Cash From Discontinued Ops. Other Operating Activities + Change In Inventories Change in Acc. Payable Change in Other Net Operating Assets Cash from Ops. Capital Expenditure Sale of Property, Plant, and Equipment Cash Acquisitions Divestitures Invest. in Marketable & Equity Securt. Net (Inc.) Dec. in Loans Originated/Sold Other Investing Activities Cash from Investing Short Term Debt Issued Long-Term Debt Issued Total Debt Issued Short Term Debt Repaid Long-Term Debt Repaid Total Debt Repaid Issuance of Common Stock Repurchase of Common Stock Common Dividends Paid (3,047.0) 63.0 u 1,875.0 24.0 28.0 28.0 (55.0) 15.0 20.0 22.0 19.0 508.0 (1,473.0) (3,075.0) (3,416.0) (2,944.0) (2,962.0) 1,977.0 1,977.0 739.0 739.0 1,739.0 1,739.0 3,225.0 (85.0) (85.0) 300.0 (3,483.0) (1,362.0) (2,649.0) (2,649.0) 221.0 (3,706.0) (1.348.0 (2,192.0) (2,192.0) 108.0 (1,046.0) (1,338.0) (281.0) (281.0) 96.0 (2,124.0) (1,335.0) (2,069.0) (2,069.0) 73.0 (1,565.0) (1,330.0) (1,169.0) 56.0 (1,609.0) (1.334.0) (1,362.0) (1,348.0) (1,338.0) (1,335.0) (1,330.0) (1,334.0) (4,630.0) 1,836.0 (5,505.0) (1,534.0) (3,729.0 131.0 (3,644.0) (1,087.0) (3,152.0) 1,021.0 (831.0) 5,628.0 i Total Dividends Paid + Special Dividend Paid + Other Financing Activities Cash from Financing Net Change in Cash Supplemental Items Cash Interest Paid Cash Taxes Paid Levered Free Cash Flow Unlevered Free Cash Flow Change in Net Working Capital Net Debt Issued Net Cash From Discontinued Ops. - Investing Filing Date Restatement Type Calculation Type 604.0 (127.0) 5,186.4 5,565.8 (1,484.0) (85.0) 19.0 Mar-14-2018 RS REP 999.0 1,514.0 3,449.3 3,804.9 204.0 (672.0) 678.0 934.0 3,675.5 4,006.8 (1,215.0) (1,453.0) 476.0 373.0 1,549.8 1,837.9 (104.0) (281.0) 492.0 696.0 3,363.1 3,655.0 (971.0) (330.0) 492.0 696.0 5,408.1 5,695.6 (2,690.0) 2,056.0 Mar-13-2019 RS REP Mar-11-2020 RS REP Mar-11-2020 NC REP Mar-11-2020 O REP Aug-28-2020 O LTM Proprietary Download Create 0 Walmart Inc. (NYSE:WMT) Financials > Cash Flow B Bata Manager Pinancials 10-10-0 EFAQs Acidity linder Items Key Stats Income Statement Balance Sheet Cash Flow Cash Flow Multiples Cap. Structure Ratios Supplemental Industry Specific Pension/OPEB Segments Restatement: Latest Filings Enable Freeze Panes Order: Go Template: Standard Period Type: Annual 79 81 85 "87 '89 '91 '93 19 1 1 In Millions of the reported currency, except per share items. Chart Selected Items Add Data Items Latest on Right "03 '05 '07 07 '09 More Options >> 17 "19" View All 83 "97 '01 '95 1 '99 1 24 '13 11 15 Restated 12 months Jan-31-2016 USD Restated 12 months Jan-31-2017 USD Restated 12 months Jan-31-2018 USD 12 months Jan-31-2019 USD For the Fiscal Period Ending LTM 12 months Jul-31-2020 USD 12 months Jan-31-2020 USD Currency 14,694.0 9,454.0 9,454.0 13,643.0 10,080.0 10,080.0 9,862.0 10,529.0 10,529.0 1,124.0 (19.0) (703.0) 2,008.0 (472.0) 1,466.0 27,552.0 (11,477.0) 635.0 Net Income Depreciation & Amort. Depreciation & Amort., Total (Gain) Loss From Sale Of Assets (Gain) Loss On Sale Of Invest. Other Operating Activities Change in Acc. Receivable Change In Inventories Change in Acc. Payable Change in Inc. Taxes Change in Other Net Operating Assets Cash from Ops. Capital Expenditure Sale of Property, plant, and Equipment Cash Acquisitions Divestitures Invest. in Marketable & Equity Securt. Net (Inc.) Dec. in Loans Originated/Sold Other Investing Activities Cash from Investing Short Term Debt Issued Long-Term Debt Issued Total Debt Issued Short Term Debt Repaid Long-Term Debt Repaid Total Debt Repaid Repurchase of Common Stock Common Dividends Paid Total Dividends Paid 1,617.0 (402.0) 1,021.0 3,942.0 492.0 1,280.0 31,673.0 (10,619.0) 456.0 (2,463.0) 662.0 (1,901.0) U 6,670.0 10,678.0 10,678.0 4,850.0 3,516.0 1,744.0 (368.0) (1,311.0) 1,831.0 (40.0) 183.0 27,753.0 (10,344.0) 519.0 (14,656.0) 876.0 4,703.0 (1,074.0) (140.0) 4,086.0 (557.0) 928.0 28,337.0 (10,051.0) 378.0 (375.0) 1,046.0 14,881.0 11,467.0 11,467.0 15.0 (1,886.0) 1,105.0 154.0 (300.0) (274.0) (93.0) 186.0 25,255.0 (10,705.0) 321.0 (56.0) 833.0 17,895.0 11,593.0 11,593.0 52.0 (5,161.0) 1,206.0 (1.0) 1,946.0 2,020.0 205.0 3,271.0 33,026.0 (9,403.0) 276.0 (175.0) 0.0 246.0 (31.0) (13,896.0) (431.0) (24,036.0) 479.0 (9,128.0) 364.0 (8,938.0) (79.0) ) (10,675.0) 1,235.0 39.0 1,274.0 (77.0) (9,079.0) 4,148.0 7,476.0 11,624.0 1,472.0 (4,432.0) (4,432.0) (4,112.0) (6,294.0) (6,294.0) 137.0 137.0 (1,673.0) (2,055.0) (3,728.0) (8,298.0) (6,216.0) (6,216.0) (13,061.0) (13,061.0) (8,296.0) (6,124.0) (6,124.0) 15,872.0 15,872.0 (53.0) (3,784.0) (3,837.0) (7,410.0) (6,102.0) (6,102.0) 5,492.0 5,492.0 (4,656.0) (1,907.0) (6,563.0) (5,717,0) (6,048.0) (6,048.0) (7,707.0) (2,733.0) ) (6,070.0) (6,070.0) i (2,721.0) (16,285.0) (1,022.0) (430.0) (967.0) (19,072.0) (452.0) (1,747.0) (4,018.0) (19,875.0) 487.0 (130.0) (1,060.0) (2,537.0) (438.0) 742.0 (1,463.0) (14,299.0) (69.0) 1,759.0 (1,544.0) (16,582.0) 128.0 7,634.0 i i i Special Dividend Paid Other Financing Activities Cash from Financing Foreign Exchange Rate Adj. Net Change in Cash Supplemental Items Cash Interest Paid Cash Taxes Paid Levered Free Cash Flow Unlevered Free Cash Flow Change in Net Working Capital Net Debt Issued Filing Date Restatement Type Calculation Type 2,540.0 8,111.0 14,540.1 16,132.6 (2,642.0) (3,158.0) Mar-30-2018 RS REP 2,351.0 4,507.0 17,910.1 19,389.5 (5,105.0) (3,591.0) Mar-28-2019 RS REP 2,450.0 6,179.0 16,498.4 17,954.6 (3,765.0) (1,437.0) Mar-20-2020 RS REP 2,348.0 3,982.0 12,984.9 14,451.1 479.0 12,035.0 Mar-20-2020 NC REP 2,464.0 3,616.0 15,145.1 16,769.5 (1,736.0) (1,071.0) Mar-20-2020 O REP 2,464.0 3,616.0 24,889.0 26,473.4 (7,790.0) (6,235.0) Sep-02-2020 O LTM