

Question
******************PLEASE USE EXCEL FORMULAS WHILE ANSWERING THE QUESTION****************************** ******************PLEASE USE EXCEL FORMULAS WHILE ANSWERING THE QUESTION****************************** Directions You have been hired by Jake to build
******************PLEASE USE EXCEL FORMULAS WHILE ANSWERING THE QUESTION******************************
******************PLEASE USE EXCEL FORMULAS WHILE ANSWERING THE QUESTION******************************
Directions
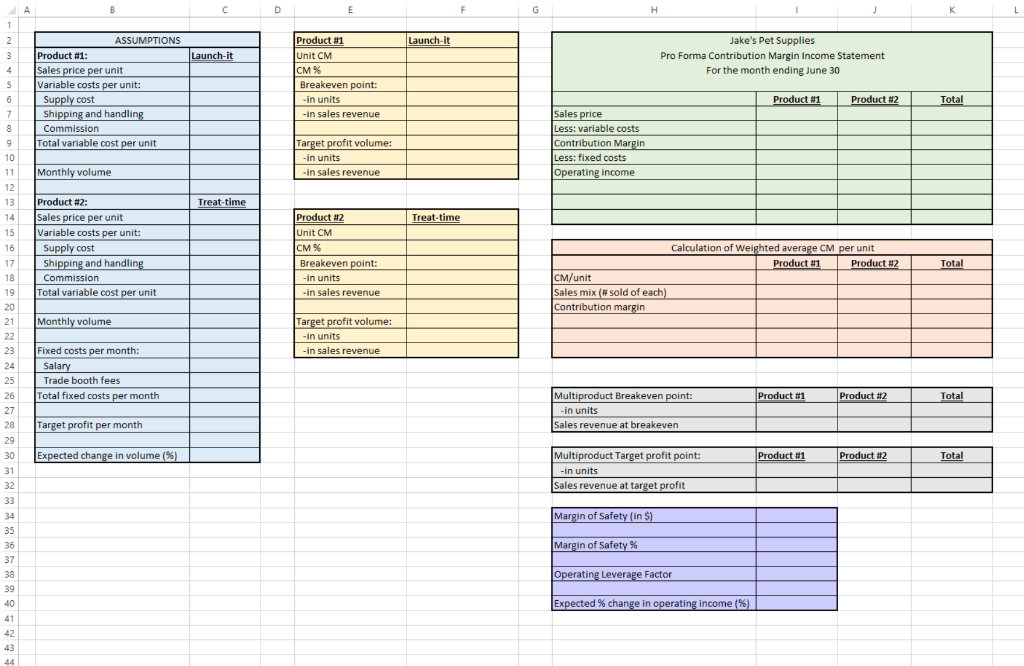
You have been hired by Jake to build a CVP model that will help him understand the impact of business conditions on his operating income. (See "Starting File" worksheet.) In your model, all of the original assumptions will be listed one area of the spreadsheet (blue box). All other calculations in the model will reference the assumptions. To accomplish this goal, you will use FORMULAs, rather than numbers, in every other cell in the worksheet.
FORMATTING conventions to use throughout project:
- Round all UNITS to the nearest whole unit. Use the "decrease decimals" button on your tool bar rather than the Rounding function.
- Show all MONETARY amounts as dollars and cents. Round to the nearest cent. ($x.xx). Use the "decrease decimals" button rather than the rounding function.
- Show all percentages as %, not as decimals. (x%, not .xx)
- Right justify all cells (numbers should be to the right side of the cell, not in the middle or left)
1) Complete the assumptions (blue box) based on the data about Jake's business. Identify and list all variable costs separately and all fixed costs separately before finding the total for each type of cost.
2) Complete the Product Analysis (yellow boxes) assuming Jake only sells either Product #1 (Launch-its) OR Product #2 (Treat -times).
Check figures: B/E Product #1 = 250 units; B/E Product #2= 125 units
3) Complete the pro forma CM Income Statement for the month of June (green box). HINT: On product line income statements such as this, the fixed costs are only listed in the total column. Make sure you also show the totals for all other line items.
Check figure: Operating income = $900
4) Calculate the TOTAL number of units needed to breakeven (TOTAL column in the first gray box). THEN, calculate the number of EACH type of product needed to breakeven. Finally, calculate the sales revenue associated with this volume for EACH product, and then the sales revenue to breakeven in total.
Check figures: B/E Product #1 = 125; B/E Product #2= 63
5) Calculate the total number of units needed to achieve Jake's target profit (TOTAL column in the second gray box). THEN, calculate the number of EACH type of product needed to achieve the target profit. Finally, calculate sales revenue associated with this volume for EACH product, and then the sales revenue in total.
Check figures: B/E Product #1 =792; B/E Product #2= 396
6) Calculate the MOS using June sales as the expected sales (purple box). Calculate the MOS in terms of sales revenue and as a percentage. Also calculate the current operating leverage factor (round to the nearest 2 decimal places) and use it to determine the expected percentage change in operating income stemming from an expected change in sales volume.
Check figures: MOS%= 38%; Operating leverage factor= 2.67
Step by Step Solution
There are 3 Steps involved in it
Step: 1

Get Instant Access to Expert-Tailored Solutions
See step-by-step solutions with expert insights and AI powered tools for academic success
Step: 2

Step: 3
Ace Your Homework with AI
Get the answers you need in no time with our AI-driven, step-by-step assistance
Get Started
Accounting Information System
Authors: James A. Hall
7th Edition
978-1439078570, 1439078572