Please use excel to complete this


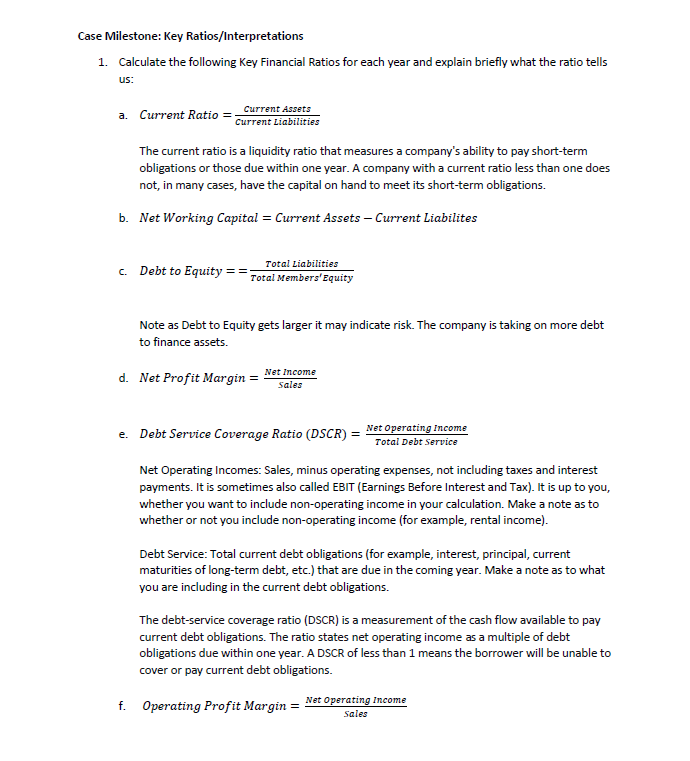
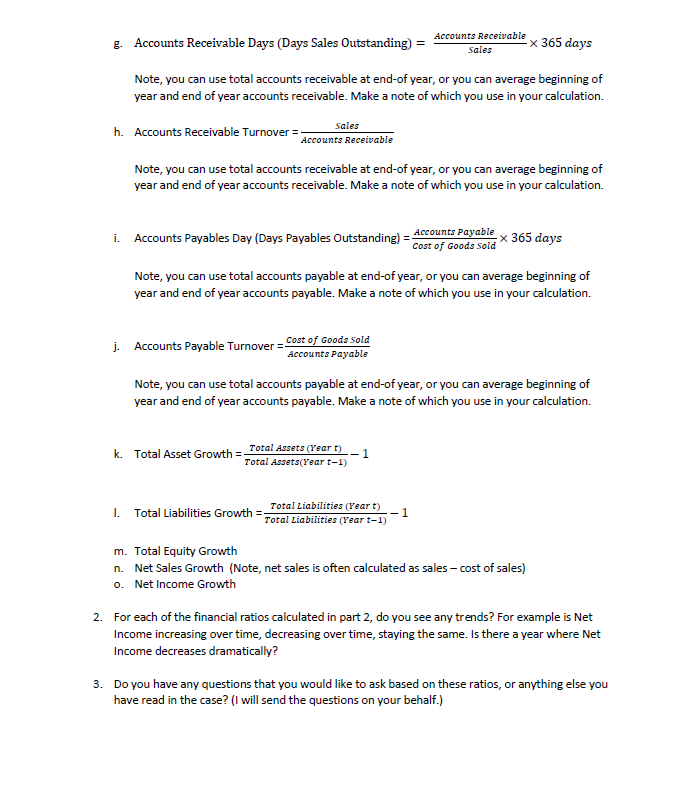
Case Milestone: Key Ratios/Interpretations 1. Calculate the following Key Financial Ratios for each year and explain briefly what the ratio tells us: a. Current Ratio = Current Liabilities The current ratio is a liquidity ratio that measures a company's ability to pay short-term obligations or those due within one year. A company with a current ratio less than one does not, in many cases, have the capital on hand to meet its short-term obligations. b. Net Working Capital = Current Assets - Current Liabilites C Debt to Equity = Total Liabilities Total Members' Equity Note as Debt to Equity gets larger it may indicate risk. The company is taking on more debt to finance assets. d. Net Profit Margin = Net Income e. Debt Service Coverage Ratio (DSCR) = Net Operating income Total Debt Service Net Operating Incomes: Sales, minus operating expenses, not including taxes and interest payments. It is sometimes also called EBIT (Earnings Before Interest and Tax). It is up to you, whether you want to include non-operating income in your calculation. Make a note as to whether or not you include non-operating income (for example, rental income). Debt Service: Total current debt obligations (for example, interest, principal, current maturities of long-term debt, etc.) that are due in the coming year. Make a note as to what you are including in the current debt obligations. The debt-service coverage ratio (DSCR) is a measurement of the cash flow available to pay current debt obligations. The ratio states net operating income as a multiple of debt obligations due within one year. A DSCR of less than 1 means the borrower will be unable to cover or pay current debt obligations. f. Operating Profit Margin = Net Operating income Sales & Accounts Receivable Days (Days Sales Outstanding) = ? - Accounts Receivable x 365 days Sales Note, you can use total accounts receivable at end-of year, or you can average beginning of year and end of year accounts receivable. Make a note of which you use in your calculation. h. Accounts Receivable Turnover = Accounts Receivable Note, you can use total accounts receivable at end-of year, or you can average beginning of year and end of year accounts receivable. Make a note of which you use in your calculation. 1- Accounts Payable i. Accounts Payables Day (Days Payables Outstanding) = Cost of Goods sold X 365 days Note, you can use total accounts payable at end-of year, or you can average beginning of year and end of year accounts payable. Make a note of which you use in your calculation. j. Accounts Payable Turnover - Cost of Goods Sold Accounts Payable Note, you can use total accounts payable at end-of year, or you can average beginning of year and end of year accounts payable. Make a note of which you use in your calculation. k. Total Asset Growth = Total Assets (Yeart) " Total Assets(Yeart-1) I Total Liabilities Growth Total Liabilities (Yeart) Total Liabilities (Yeart-1- -1 m. Total Equity Growth n. Net Sales Growth (Note, net sales is often calculated as sales - cost of sales) o. Net Income Growth 2. For each of the financial ratios calculated in part 2, do you see any trends? For example is Net Income increasing over time, decreasing over time, staying the same. Is there a year where Net Income decreases dramatically? 3. Do you have any questions that you would like to ask based on these ratios, or anything else you have read in the case? (I will send the questions on your behalf.) Case Milestone: Key Ratios/Interpretations 1. Calculate the following Key Financial Ratios for each year and explain briefly what the ratio tells us: a. Current Ratio = Current Liabilities The current ratio is a liquidity ratio that measures a company's ability to pay short-term obligations or those due within one year. A company with a current ratio less than one does not, in many cases, have the capital on hand to meet its short-term obligations. b. Net Working Capital = Current Assets - Current Liabilites C Debt to Equity = Total Liabilities Total Members' Equity Note as Debt to Equity gets larger it may indicate risk. The company is taking on more debt to finance assets. d. Net Profit Margin = Net Income e. Debt Service Coverage Ratio (DSCR) = Net Operating income Total Debt Service Net Operating Incomes: Sales, minus operating expenses, not including taxes and interest payments. It is sometimes also called EBIT (Earnings Before Interest and Tax). It is up to you, whether you want to include non-operating income in your calculation. Make a note as to whether or not you include non-operating income (for example, rental income). Debt Service: Total current debt obligations (for example, interest, principal, current maturities of long-term debt, etc.) that are due in the coming year. Make a note as to what you are including in the current debt obligations. The debt-service coverage ratio (DSCR) is a measurement of the cash flow available to pay current debt obligations. The ratio states net operating income as a multiple of debt obligations due within one year. A DSCR of less than 1 means the borrower will be unable to cover or pay current debt obligations. f. Operating Profit Margin = Net Operating income Sales & Accounts Receivable Days (Days Sales Outstanding) = ? - Accounts Receivable x 365 days Sales Note, you can use total accounts receivable at end-of year, or you can average beginning of year and end of year accounts receivable. Make a note of which you use in your calculation. h. Accounts Receivable Turnover = Accounts Receivable Note, you can use total accounts receivable at end-of year, or you can average beginning of year and end of year accounts receivable. Make a note of which you use in your calculation. 1- Accounts Payable i. Accounts Payables Day (Days Payables Outstanding) = Cost of Goods sold X 365 days Note, you can use total accounts payable at end-of year, or you can average beginning of year and end of year accounts payable. Make a note of which you use in your calculation. j. Accounts Payable Turnover - Cost of Goods Sold Accounts Payable Note, you can use total accounts payable at end-of year, or you can average beginning of year and end of year accounts payable. Make a note of which you use in your calculation. k. Total Asset Growth = Total Assets (Yeart) " Total Assets(Yeart-1) I Total Liabilities Growth Total Liabilities (Yeart) Total Liabilities (Yeart-1- -1 m. Total Equity Growth n. Net Sales Growth (Note, net sales is often calculated as sales - cost of sales) o. Net Income Growth 2. For each of the financial ratios calculated in part 2, do you see any trends? For example is Net Income increasing over time, decreasing over time, staying the same. Is there a year where Net Income decreases dramatically? 3. Do you have any questions that you would like to ask based on these ratios, or anything else you have read in the case? (I will send the questions on your behalf.)


