

Answered step by step
Verified Expert Solution
Question
1 Approved Answer
please use excel! To see the impact of the interest rate on an investment, (a) Invest $100,000 at 6% for 35 years. Calculate the accumulated
please use excel!
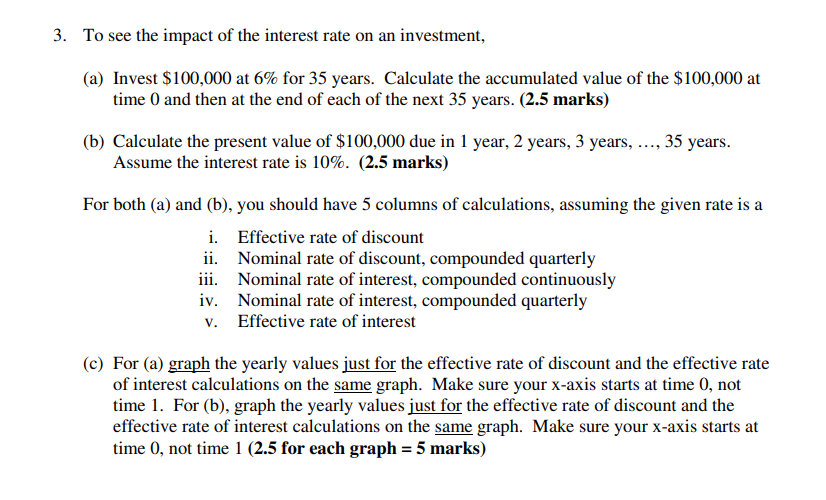
To see the impact of the interest rate on an investment, (a) Invest $100,000 at 6% for 35 years. Calculate the accumulated value of the $100,000 at time 0 and then at the end of each of the next 35 years. (2.5 marks) (b) Calculate the present value of $100,000 due in 1 year, 2 years, 3 years, .., 35 years. Assume the interest rate is 10%. (2.5 marks) For both (a) and (b), you should have 5 columns of calculations, assuming the given rate is a i. Effective rate of discount ii. Nominal rate of discount, compounded quarterly iii. Nominal rate of interest, compounded continuously iv. Nominal rate of interest, compounded quarterly v. Effective rate of interest (c) For (a) graph the yearly values just for the effective rate of discount and the effective rate of interest calculations on the same graph. Make sure your x-axis starts at time 0 , not time 1. For (b), graph the yearly values just for the effective rate of discount and the effective rate of interest calculations on the same graph. Make sure your x-axis starts at time 0 , not time 1 ( 2.5 for each graph =5 marks) To see the impact of the interest rate on an investment, (a) Invest $100,000 at 6% for 35 years. Calculate the accumulated value of the $100,000 at time 0 and then at the end of each of the next 35 years. (2.5 marks) (b) Calculate the present value of $100,000 due in 1 year, 2 years, 3 years, .., 35 years. Assume the interest rate is 10%. (2.5 marks) For both (a) and (b), you should have 5 columns of calculations, assuming the given rate is a i. Effective rate of discount ii. Nominal rate of discount, compounded quarterly iii. Nominal rate of interest, compounded continuously iv. Nominal rate of interest, compounded quarterly v. Effective rate of interest (c) For (a) graph the yearly values just for the effective rate of discount and the effective rate of interest calculations on the same graph. Make sure your x-axis starts at time 0 , not time 1. For (b), graph the yearly values just for the effective rate of discount and the effective rate of interest calculations on the same graph. Make sure your x-axis starts at time 0 , not time 1 ( 2.5 for each graph =5 marks)Step by Step Solution
There are 3 Steps involved in it
Step: 1

Get Instant Access to Expert-Tailored Solutions
See step-by-step solutions with expert insights and AI powered tools for academic success
Step: 2

Step: 3
Ace Your Homework with AI
Get the answers you need in no time with our AI-driven, step-by-step assistance
Get Started
Finance For Freelancers Financial Intelligence
Authors: Andrew Holmes
1st Edition
1408101165, 978-1408101162