

Answered step by step
Verified Expert Solution
Question
1 Approved Answer
please use MATLAB codes to answer this question and please explain each code Frequency spectrum. While it is perhaps most intuitive to consider signals in
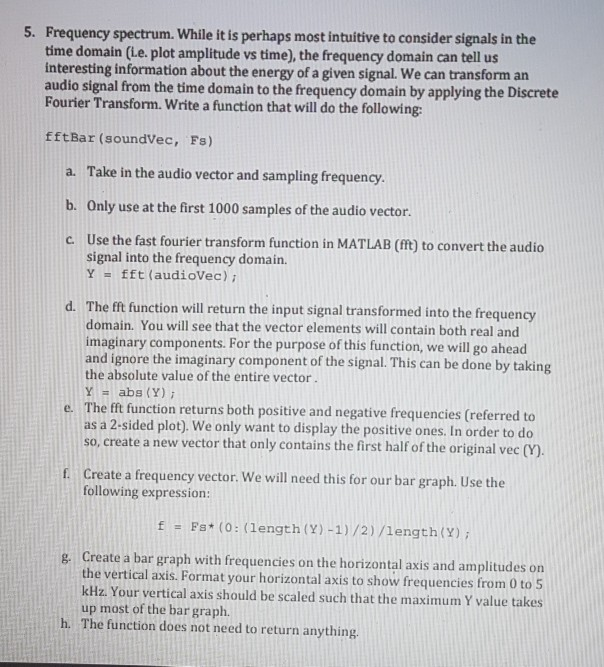
please use MATLAB codes to answer this question and please explain each code
Frequency spectrum. While it is perhaps most intuitive to consider signals in the time domain (Le plot amplitude vs time), the frequency domain can tell us interesting information about the energy of a given signal. We can transform an audio signal from the time domain to the frequency domain by applying the Discrete Fourier Transform. Write a function that will do the following 5. fftBar (soundVec, Fs) a. Take in the audio vector and sampling frequency. b. Only use at the first 1000 samples of the audio vector. c. Use the fast fourier transform function in MATLAB (fft) to convert the audio signal into the frequency domain. Y- fft (audioVec) The fft function will return the input signal trans domain. You will see that the vector elements will contain both real and imaginary components. For the purpose of this function, we will go ahead and ignore the imaginary component of the signal. This can be done by taking the absolute value of the entire vector Y abs (Y) i d. formed into the frequency e. The fft function returns both positive and negative frequencies (referred to as a 2-sided plot). We only want to display the positive ones. In order to do so, create a new vector that only contains the first half of the original vec (Y). f Create a frequency vector. We will need this for our bar graph. Use the following expression: E Fst (: (length (Y) -1)/2)/length(Y) a Create a bar graph with frequencies on the horizontal axis and amplitudes on the vertical axis. Format your horizontal axis to show frequencies from 0 to kHz. Your vertical axis should be scaled such that the maximum Y value takes up most of the bar graph. The function does not need to return anything. g. hStep by Step Solution
There are 3 Steps involved in it
Step: 1

Get Instant Access to Expert-Tailored Solutions
See step-by-step solutions with expert insights and AI powered tools for academic success
Step: 2

Step: 3
Ace Your Homework with AI
Get the answers you need in no time with our AI-driven, step-by-step assistance
Get Started
The Ultimate Apache Flink Introduction Streamlined Data Mastering Apache Flink For Real Time Processing
Authors: Big Data Landscape
1st Edition
B0CNN5YBX5, 979-8868164415