Answered step by step
Verified Expert Solution
Question
1 Approved Answer
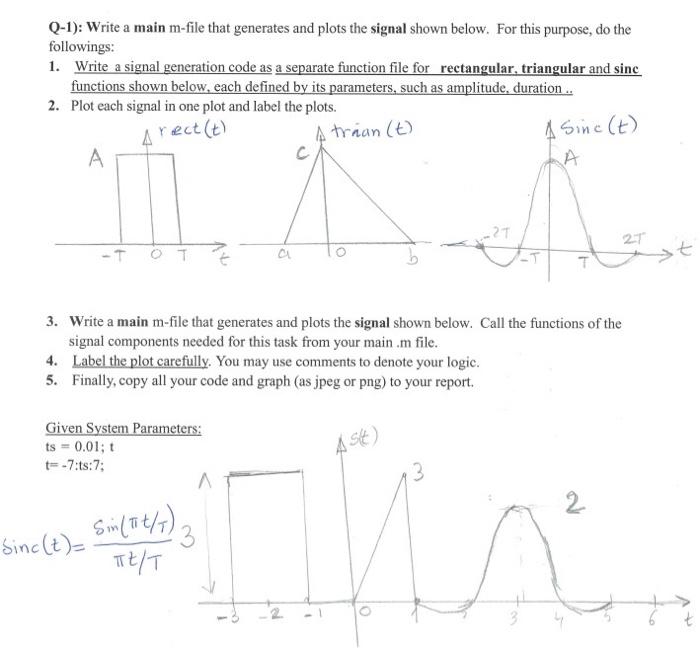
please use matlab Q-1): Write a main m-file that generates and plots the signal shown below. For this purpose, do the followings: 1. Write a
please use matlab 
Q-1): Write a main m-file that generates and plots the signal shown below. For this purpose, do the followings: 1. Write a signal generation code as a separate function file for rectangular, triangular and sinc functions shown below, each defined by its parameters, such as amplitude, duration .. 2. Plot each signal in one plot and label the plots. 3. Write a main m-file that generates and plots the signal shown below. Call the functions of the signal components needed for this task from your main .m file. 4. Label the plot carefully. You may use comments to denote your logic. 5. Finally, copy all your code and graph (as jpeg or png) to your report. Given System Par ts=0.01;tt=7:ts:7; sinc(t)=t)sin(t) 
Step by Step Solution
There are 3 Steps involved in it
Step: 1

Get Instant Access to Expert-Tailored Solutions
See step-by-step solutions with expert insights and AI powered tools for academic success
Step: 2

Step: 3

Ace Your Homework with AI
Get the answers you need in no time with our AI-driven, step-by-step assistance
Get Started


