

Answered step by step
Verified Expert Solution
Question
1 Approved Answer
Please use MatLab, thanks! Create a vector of angles from 0 to 2. Use the polar plotting function to create graphs of the functions that
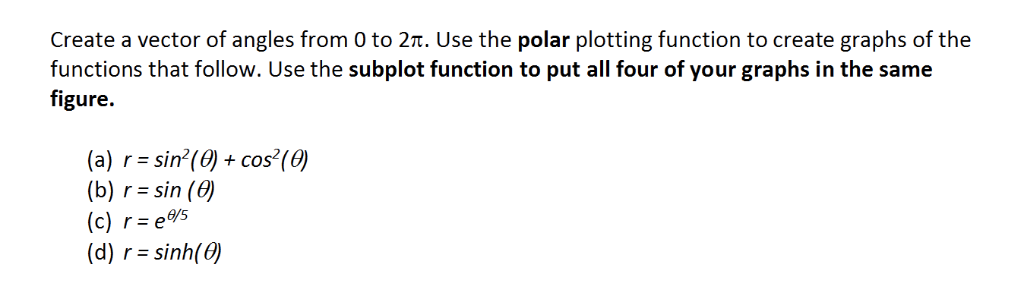
Please use MatLab, thanks!
Create a vector of angles from 0 to 2. Use the polar plotting function to create graphs of the functions that follow. Use the subplot function to put all four of your graphs in the same figure. + COS (b) rsin (e) (c) r ees (d) : sinh() Create a vector of angles from 0 to 2. Use the polar plotting function to create graphs of the functions that follow. Use the subplot function to put all four of your graphs in the same figure. + COS (b) rsin (e) (c) r ees (d) : sinh()Step by Step Solution
There are 3 Steps involved in it
Step: 1

Get Instant Access to Expert-Tailored Solutions
See step-by-step solutions with expert insights and AI powered tools for academic success
Step: 2

Step: 3
Ace Your Homework with AI
Get the answers you need in no time with our AI-driven, step-by-step assistance
Get Started
Database Systems On GPUs In Databases
Authors: Johns Paul ,Shengliang Lu ,Bingsheng He
1st Edition
1680838482, 978-1680838480