Answered step by step
Verified Expert Solution
Question
1 Approved Answer
To get an overview of the data, we will first do univariate From 1962 to 1969 a number of patients with liver cirrhosis at

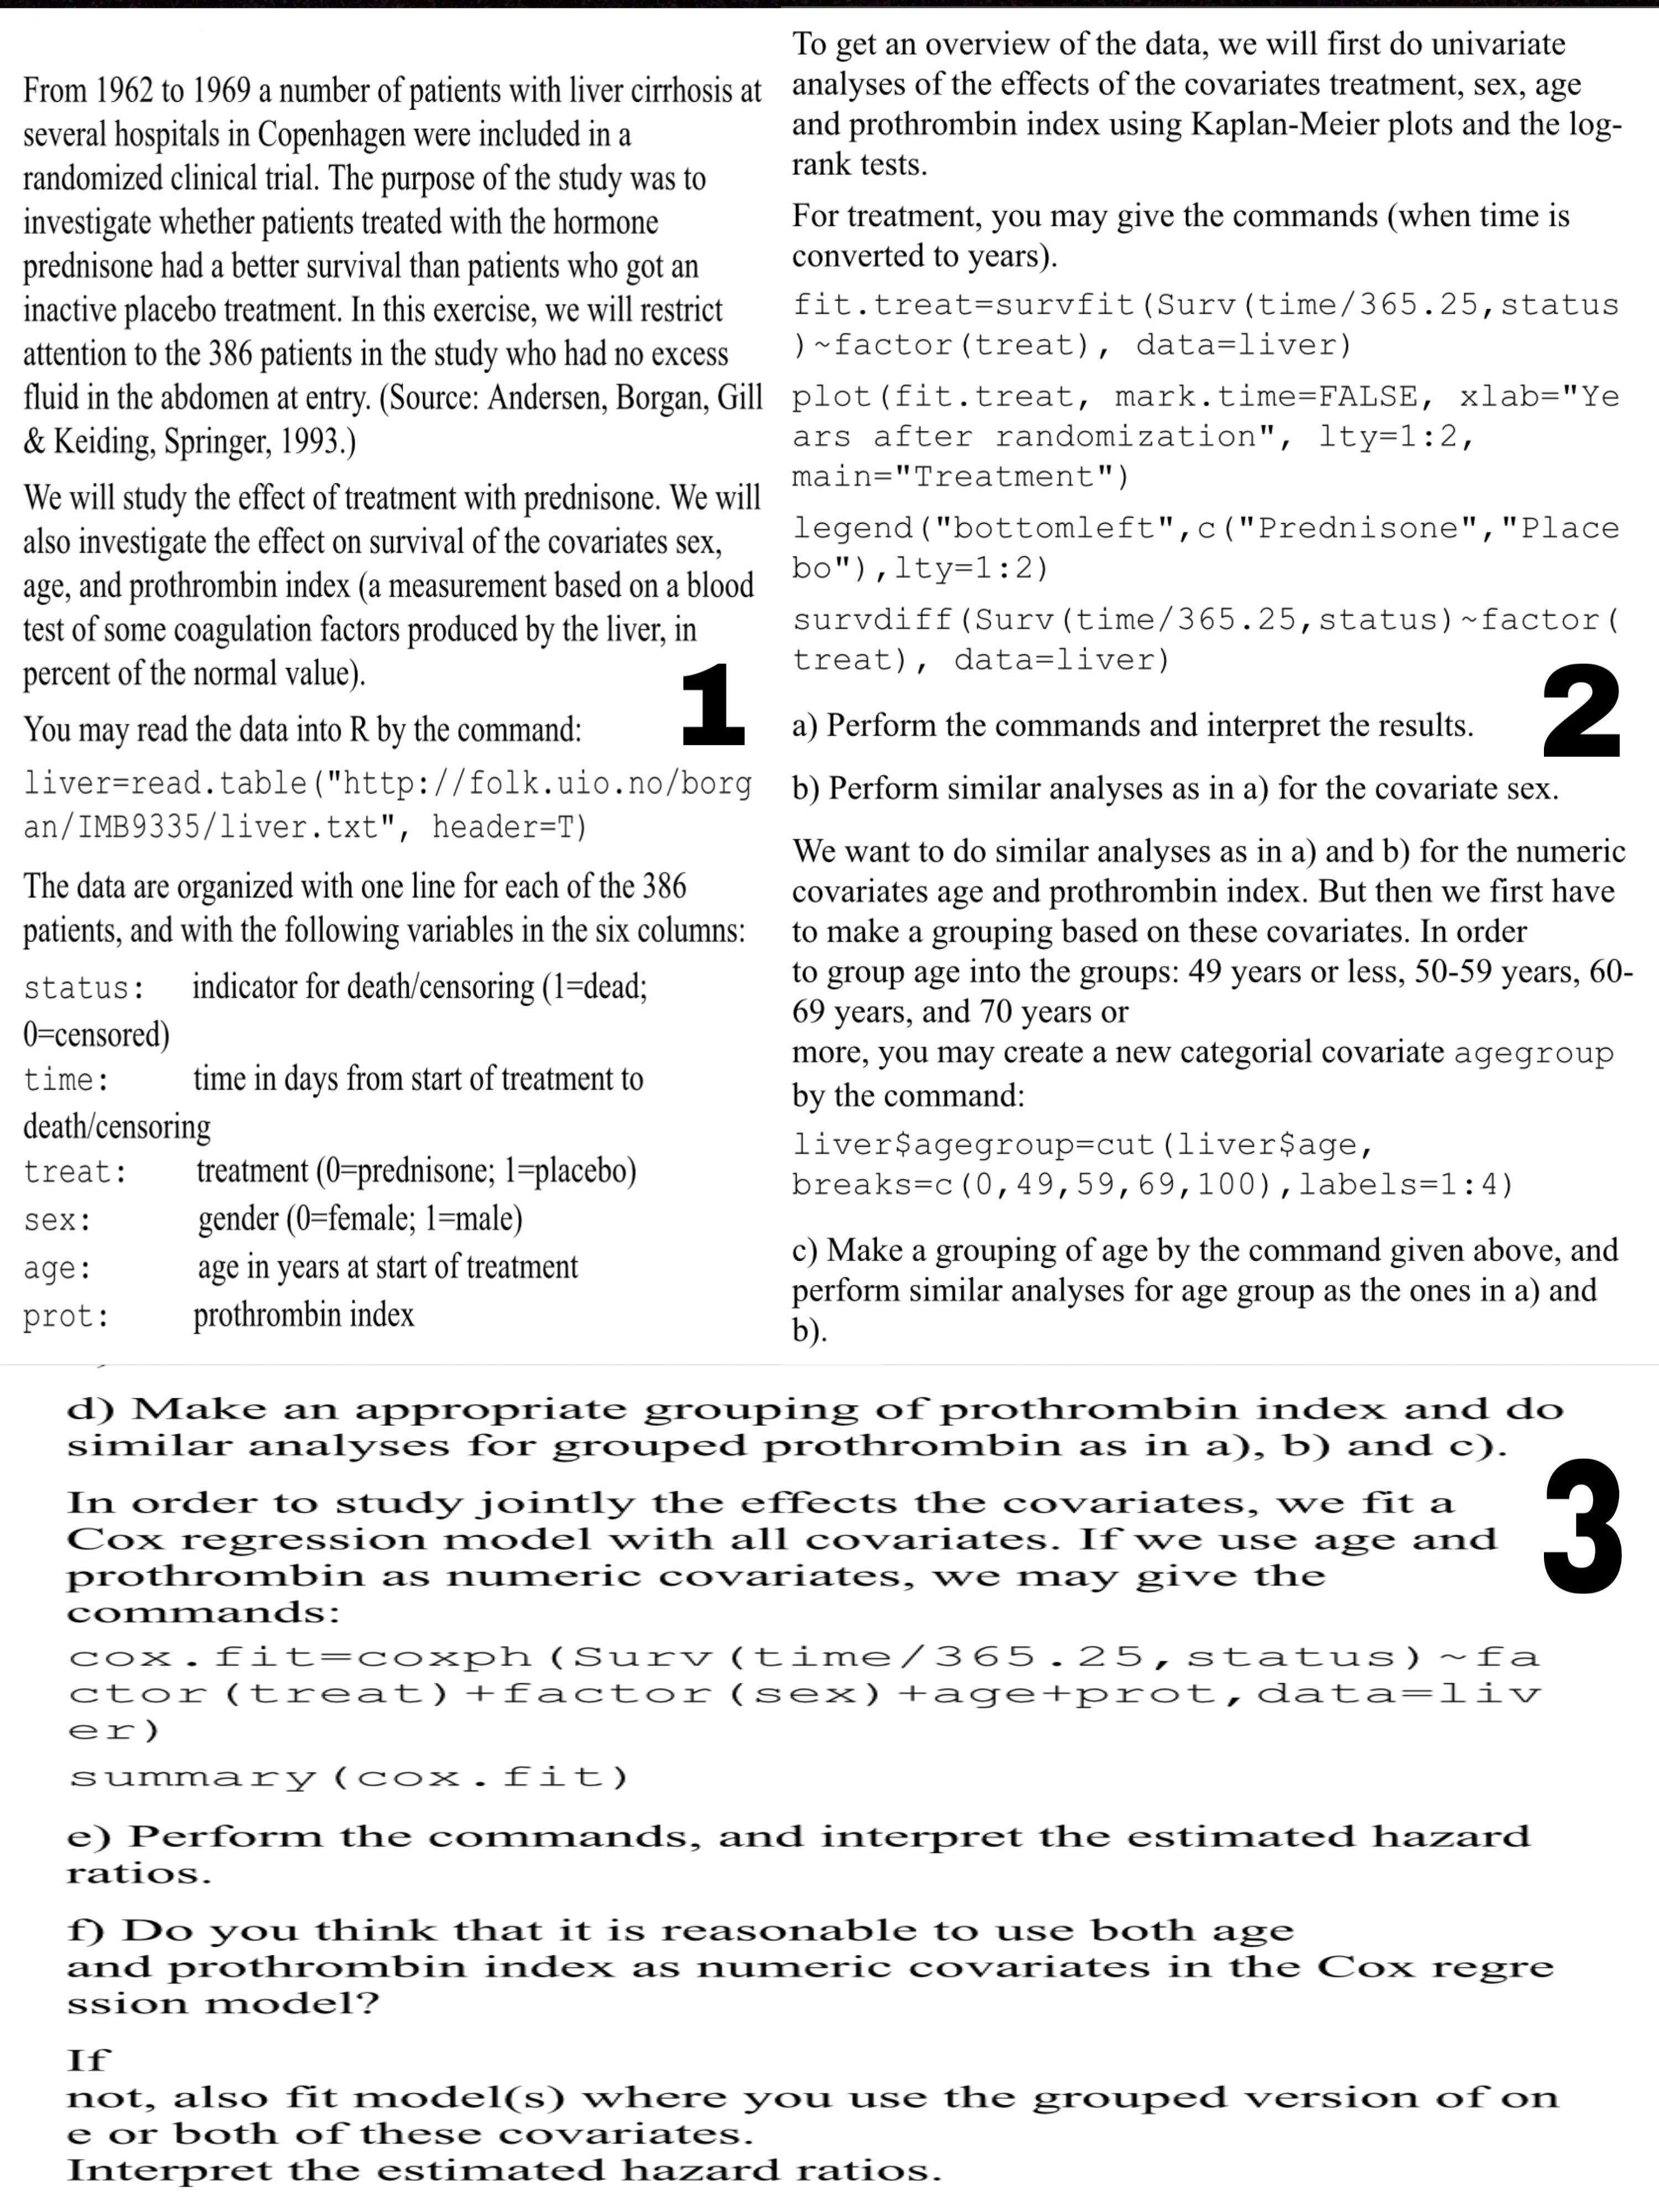
To get an overview of the data, we will first do univariate From 1962 to 1969 a number of patients with liver cirrhosis at analyses of the effects of the covariates treatment, sex, age several hospitals in Copenhagen were included in a and prothrombin index using Kaplan-Meier plots and the log- rank tests. randomized clinical trial. The purpose of the study was to investigate whether patients treated with the hormone prednisone had a better survival than patients who got an inactive placebo treatment. In this exercise, we will restrict attention to the 386 patients in the study who had no excess fluid in the abdomen at entry. (Source: Andersen, Borgan, Gill & Keiding, Springer, 1993.) We will study the effect of treatment with prednisone. We will also investigate the effect on survival of the covariates sex, age, and prothrombin index (a measurement based on a blood test of some coagulation factors produced by the liver, in percent of the normal value). 1 You may read the data into R by the command: liver=read.table ("http://folk.uio.no/borg an/IMB9335/liver.txt", header=T) The data are organized with one line for each of the 386 patients, and with the following variables in the six columns: status: indicator for death/censoring (1=dead; 0=censored) time: time in days from start of treatment to death/censoring treat: treatment (0=prednisone; 1=placebo) gender (0=female; 1=male) age in years at start of treatment prothrombin index sex: age: prot: For treatment, you may give the commands (when time is converted to years). fit.treat=survfit (Surv (time/365.25, status ) ~factor (treat), data=liver) plot (fit.treat, mark.time=FALSE, xlab="Ye ars after randomization", lty=1:2, main="Treatment") legend ("bottomleft",c("Prednisone", "Place bo"),lty=1:2) survdiff (Surv (time/365.25, status) ~factor ( treat), data=liver) 2 a) Perform the commands and interpret the results. b) Perform similar analyses as in a) for the covariate sex. We want to do similar analyses as in a) and b) for the numeric covariates age and prothrombin index. But then we first have to make a grouping based on these covariates. In order to group age into the groups: 49 years or less, 50-59 years, 60- 69 years, and 70 years or more, you may create a new categorial covariate agegroup by the command: liver$agegroup-cut (liver$age, breaks-c (0, 49, 59, 69, 100), labels=1:4) c) Make a grouping of age by the command given above, and perform similar analyses for age group as the ones in a) and b). d) Make an appropriate grouping of prothrombin index and do similar analyses for grouped prothrombin as in a), b) and c). In order to study jointly the effects the covariates, we fit a Cox regression model with all covariates. If we use age and prothrombin as numeric covariates, we may give the 3 commands: cox.fit=coxph (Surv(time/365.25,status) ~fa ctor (treat) +factor (sex)+age+prot,data=liv er) summary(cox.fit) e) Perform the commands, and interpret the estimated hazard ratios. f) Do you think that it is reasonable to use both age and prothrombin index as numeric covariates in the Cox regre ssion model? If not, also fit model(s) where you use the grouped version of on e or both of these covariates. Interpret the estimated hazard ratios.
Step by Step Solution
★★★★★
3.37 Rating (150 Votes )
There are 3 Steps involved in it
Step: 1
Answer in image Answer 2 Given ty 05 years for substance it I is the decay constant of substance A ...
Get Instant Access to Expert-Tailored Solutions
See step-by-step solutions with expert insights and AI powered tools for academic success
Step: 2

Step: 3

Ace Your Homework with AI
Get the answers you need in no time with our AI-driven, step-by-step assistance
Get Started


