

Question
Please use the following data to answer the questions. The ticker symbols are for Tesla Inc (TSLA), Barrick Gold Corporation (GOLD) and Apple Inc (AAPL).
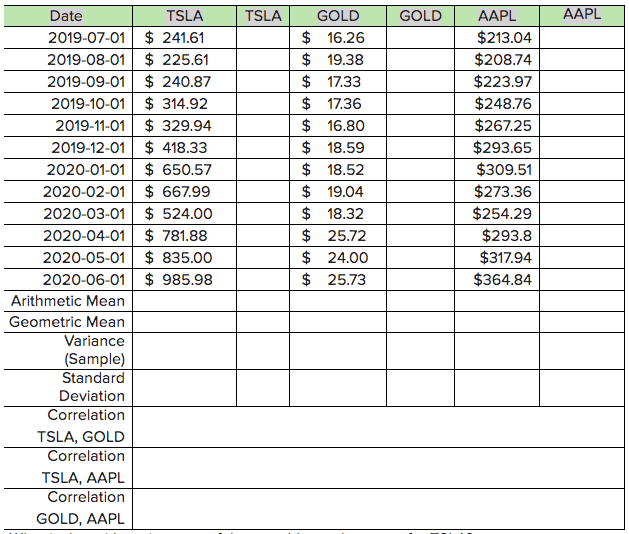
Please use the following data to answer the questions. The ticker symbols are for Tesla Inc (TSLA), Barrick Gold Corporation (GOLD) and Apple Inc (AAPL). The prices shown are the closing stock prices for the date shown. Your first task is to compute the monthly holding period returns for each stock for each month, using the Holding Period Return formula, which is HPR = (P1 - P0)/P0, where P1 is the end of period price and P0 is the start of period price. Be very careful to not mix up your dates. After you have computed the HPRs.
What is the arithmetic mean of the monthly stock returns for TSLA?
1. 15.7% 2. 13.4% 3. 16.9% 4. 19.4%
Assume you had invested $10,000 in TSLA July 1, 2019, the first date of the sample. What would your investment be worth on the last date of the period?
1. $62,967, 2. $40,659, 3. $34,645 4. $45,639
Assume you have a portfolio of $20,000, invested 60% in TSLA and 40% in GOLD. What return would you expect for the portfolio, using the formula for portfolio return?
1. 11.5% 2. 10.6% 3. 25.4% 4.13.8%
According to Yahoo Finance, Barricks beta is 0.33, as of June 26, 2020. If the yield on T Bills is currently 15 basis points (0.15%) and the return on the market is 8%, what return do you require to hold Barrick stock, based on its market risk?
1. 3.45% 2. 2.74% 3. 3.65% 4. 1.75%
TSLA GOLD AAPL Date TSLA 2019-07-01 $ 241.61 2019-08-01 $ 225.61 2019-09-01 $ 240.87 2019-10-01 $ 314.92 2019-11-01 $ 329.94 2019-12-01 $ 418.33 2020-01-01 $ 650.57 2020-02-01 $ 667.99 2020-03-01 $ 524.00 2020-04-01 $ 781.88 2020-05-01 $ 835.00 2020-06-01 $ 985.98 Arithmetic Mean Geometric Mean Variance (Sample) Standard Deviation Correlation TSLA, GOLD Correlation TSLA, AAPL Correlation GOLD, AAPL GOLD $ 16.26 $ 19.38 $ 17.33 $ 17.36 $ 16.80 $ 18.59 $ 18.52 $ 19.04 $ 18.32 $ 25.72 $ 24.00 $ 25.73 AAPL $213.04 $208.74 $223.97 $248.76 $267.25 $293.65 $309.51 $273.36 $254.29 $293.8 $317.94 $364.84 TSLA GOLD AAPL Date TSLA 2019-07-01 $ 241.61 2019-08-01 $ 225.61 2019-09-01 $ 240.87 2019-10-01 $ 314.92 2019-11-01 $ 329.94 2019-12-01 $ 418.33 2020-01-01 $ 650.57 2020-02-01 $ 667.99 2020-03-01 $ 524.00 2020-04-01 $ 781.88 2020-05-01 $ 835.00 2020-06-01 $ 985.98 Arithmetic Mean Geometric Mean Variance (Sample) Standard Deviation Correlation TSLA, GOLD Correlation TSLA, AAPL Correlation GOLD, AAPL GOLD $ 16.26 $ 19.38 $ 17.33 $ 17.36 $ 16.80 $ 18.59 $ 18.52 $ 19.04 $ 18.32 $ 25.72 $ 24.00 $ 25.73 AAPL $213.04 $208.74 $223.97 $248.76 $267.25 $293.65 $309.51 $273.36 $254.29 $293.8 $317.94 $364.84Step by Step Solution
There are 3 Steps involved in it
Step: 1

Get Instant Access to Expert-Tailored Solutions
See step-by-step solutions with expert insights and AI powered tools for academic success
Step: 2

Step: 3
Ace Your Homework with AI
Get the answers you need in no time with our AI-driven, step-by-step assistance
Get Started
Blood Audit
Authors: Edward S Blythe
1st Edition
1480180394, 978-1480180390