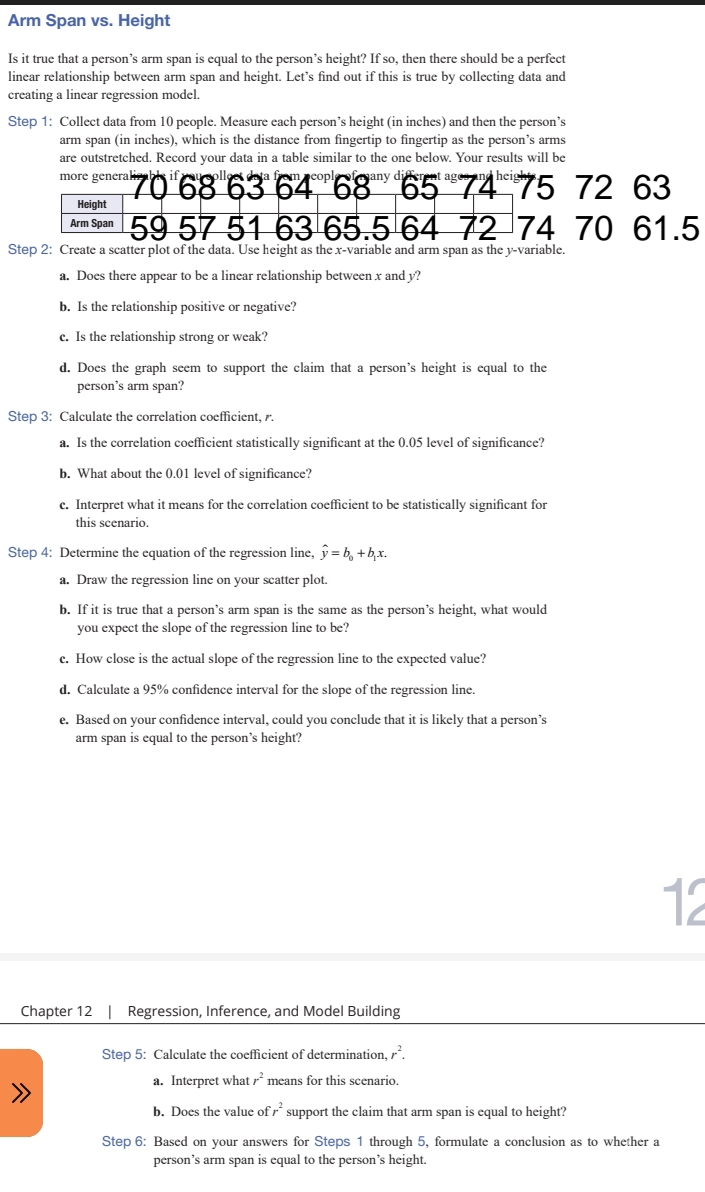
please use the following given data to answer all the steps.Height 70 68 63 64 68 65 74 75 72 63 Arm Span 59 57 51 63 65.5 64 72 74 70 61.5Requirements:Include the following information. ? Collected Data ? Scatter Plot (screen shot of your calculator screen/Excel/Google Sheets) ? Linear Regression Equation (show your work/calculator screen) ? Graph the Linear Regression Equation on the Scatter Plot Calculated Correlation Coefficient (show your work/calculator screen) . Calculated Coefficient of Determination (show your 0 work/calculator screen) ? Conclusion - Is there a linear relationship?
Arm Span vs. Height Is it true that a person's arm span is equal to the person's height? If so, then there should be a perfect linear relationship between arm span and height. Let's find out if this is true by collecting data and creating a linear regression model. Step 1: Collect data from 10 people. Measure each person's height (in inches) and then the person's arm span (in inches), which is the distance from fingertip to fingertip as the person's arms are outstretched. Record your data in a table similar to the one below. Your results will be 70"68"63 64 68 65 74 75 72 63 Height Arm Span 59 57 51 63 65.5 64 72 74 70 61.5 Step 2: Create a scatter plot of the data. Use height as the x-variable and arm span as the y-variable. a. Does there appear to be a linear relationship between x and y? b. Is the relationship positive or negative? c. Is the relationship strong or weak? d. Does the graph seem to support the claim that a person's height is equal to the person's arm span? Step 3: Calculate the correlation coefficient, F. a. Is the correlation coefficient statistically significant at the 0.05 level of significance? b. What about the 0.01 level of significance? c. Interpret what it means for the correlation coefficient to be statistically significant for this scenario. Step 4: Determine the equation of the regression line, y = b, + b,x. a. Draw the regression line on your scatter plot. b. If it is true that a person's arm span is the same as the person's height, what would you expect the slope of the regression line to be? c. How close is the actual slope of the regression line to the expected value? d. Calculate a 95% confidence interval for the slope of the regression line. e. Based on your confidence interval, could you conclude that it is likely that a person's arm span is equal to the person's height? 12 Chapter 12 | Regression, Inference, and Model Building Step 5: Calculate the coefficient of determination, r. > > a. Interpret what r means for this scenario. b. Does the value of r support the claim that arm span is equal to height? Step 6: Based on your answers for Steps 1 through 5, formulate a conclusion as to whether a person's arm span is equal to the person's height