Answered step by step
Verified Expert Solution
Link Copied!

Question

1 Approved Answer

PLEASE USE THE JMP y x1 x2 x3 x4 x5 x6 x7 36.98 5.1 400 51.37 4.24 1484.83 2227.25 2.06 13.74 26.4 400 72.33 30.87

PLEASE USE THE JMP

y x1 x2 x3 x4 x5 x6 x7

36.98 5.1 400 51.37 4.24 1484.83 2227.25 2.06

13.74 26.4 400 72.33 30.87 289.94 434.9 1.33

10.08 23.8 400 71.44 33.01 320.79 481.19 0.97

8.53 46.4 400 79.15 44.61 164.76 247.14 0.62

36.42 7 450 80.47 33.84 1097.26 1645.89 0.22

26.59 12.6 450 89.9 41.26 605.06 907.59 0.76

19.07 18.9 450 91.48 41.88 405.37 608.05 1.71

5.96 30.2 450 98.6 70.79 253.7 380.55 3.93

15.52 53.8 450 98.05 66.82 142.27 213.4 1.97

56.61 5.6 400 55.69 8.92 1362.24 2043.36 5.08

26.72 15.1 400 66.29 17.98 507.65 761.48 0.6

20.8 20.3 400 58.94 17.79 377.6 566.4 0.9

6.99 48.4 400 74.74 33.94 158.05 237.08 0.63

45.93 5.8 425 63.71 11.95 130.66 1961.49 2.04

43.09 11.2 425 67.14 14.73 682.59 1023.89 1.57

15.79 27.9 425 77.65 34.49 274.2 411.3 2.38

21.6 5.1 450 67.22 14.48 1496.51 2244.77 0.32

35.19 11.7 450 81.48 29.69 652.43 978.64 0.44

26.14 16.7 450 83.88 26.33 458.42 687.62 8.82

8.6 24.8 450 89.38 37.98 312.25 468.38 0.02

11.63 24.9 450 79.77 25.66 307.08 460.62 1.72

9.59 39.5 450 87.93 22.36 193.61 290.42 1.88

4.42 29 450 79.5 31.52 155.96 233.95 1.43

38.89 5.5 460 72.73 17.86 1392.08 2088.12 1.35

11.19 11.5 450 77.88 25.2 663.09 994.63 1.61

75.62 5.2 470 75.5 8.66 1464.11 2196.17 4.78

36.03 10.6 470 83.15 22.39 720.07 1080.11 5.88
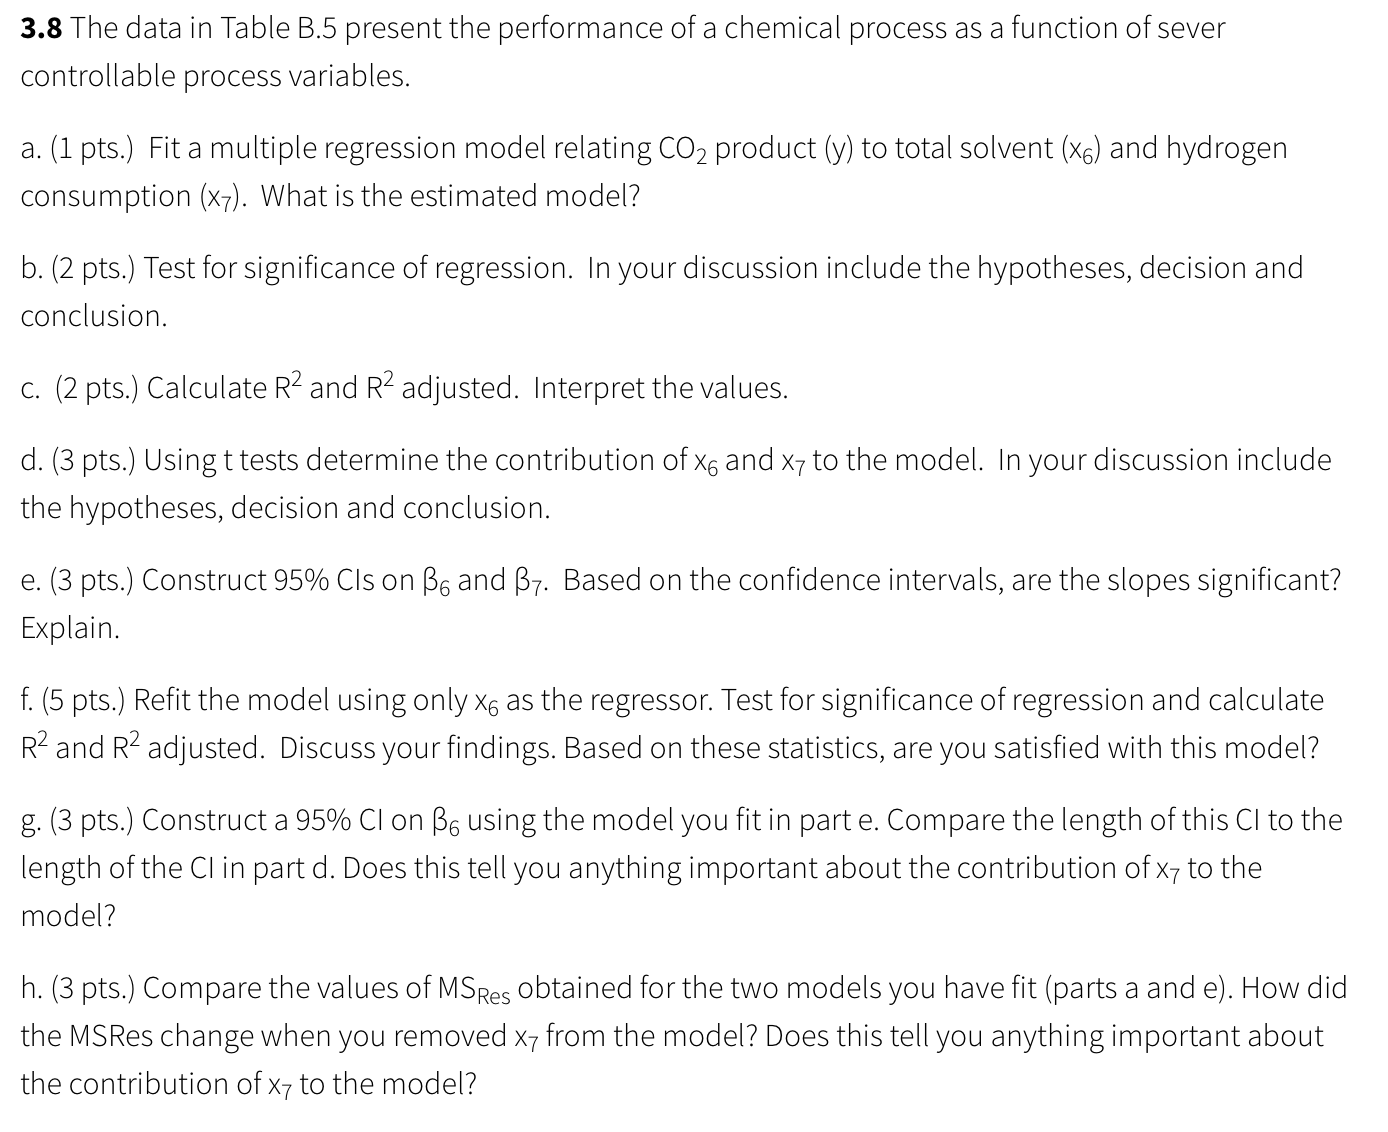
image text in transcribed
3.8 The data in Table 8.5 present the performance of a chemical process as a function of sever controllable process variables. a. (1 pts.) Fit a multiple regression model relating C02 product (y) to total solvent (x6) and hydrogen consumption (x7). What is the estimated model? b. (2 pts.) Test for significance of regression. In your discussion include the hypotheses, decision and conclusion. c. (2 pts.) Calculate R2 and R2 adjusted. Interpret the values. d. (3 pts.) Using t tests determine the contribution of x6 and X? to the model. In your discussion include the hypotheses, decision and conclusion. e. (3 pts.) Construct 95% Cls on B6 and (37. Based on the confidence intervals, are the slopes significant? Explain. f. (5 pts.) Refit the model using only x5 as the regressor. Test for significance of regression and calculate R2 and R2 adjusted. Discuss yourfindings. Based on these statistics, are you satisfied with this model? g. (3 pts.) Construct a 95% CI on (35 usingthe model you fit in part e. Compare the length of this CI to the length ofthe CI in part d. Does this tell you anything important about the contribution OfX7 to the model? h. (3 pts.) Compare the values of MSRes obtained for the two models you have fit (parts a and e). How did the MSRes change when you removed x7 from the model? Does this tell you anything important about the contribution ofx7 to the model

Step by Step Solution

There are 3 Steps involved in it

Step: 1

blur-text-image

Get Instant Access to Expert-Tailored Solutions

See step-by-step solutions with expert insights and AI powered tools for academic success

Step: 2

blur-text-image

Step: 3

blur-text-image

Ace Your Homework with AI

Get the answers you need in no time with our AI-driven, step-by-step assistance

Get Started

Recommended Textbook for

Elementary Statisitcs

Authors: Barry Monk

2nd edition

1259345297, 978-0077836351, 77836359, 978-1259295911, 1259295915, 978-1259292484, 1259292487, 978-1259345296

More Books

Students also viewed these Mathematics questions