

Answered step by step
Verified Expert Solution
Question
1 Approved Answer
please use the picture to answer the question thanks! Observe the two charts: Comment if you see any points beyond the control limits or close
please use the picture to answer the question
thanks!
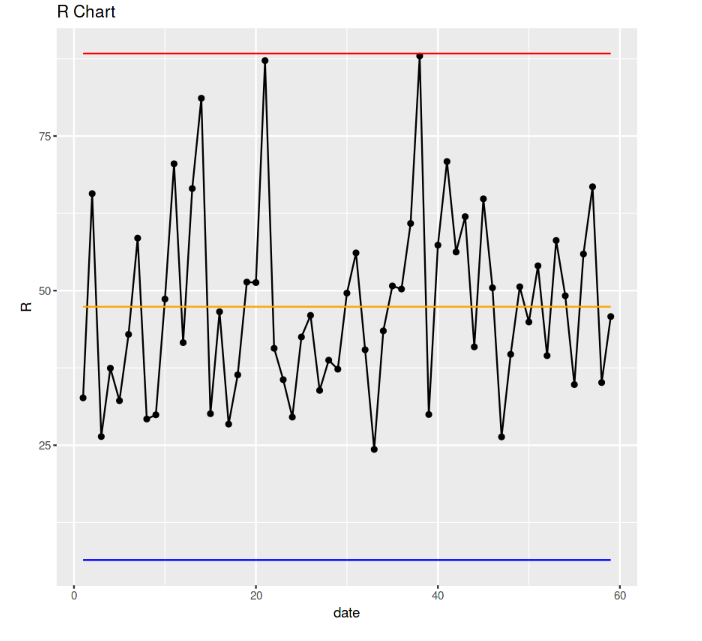
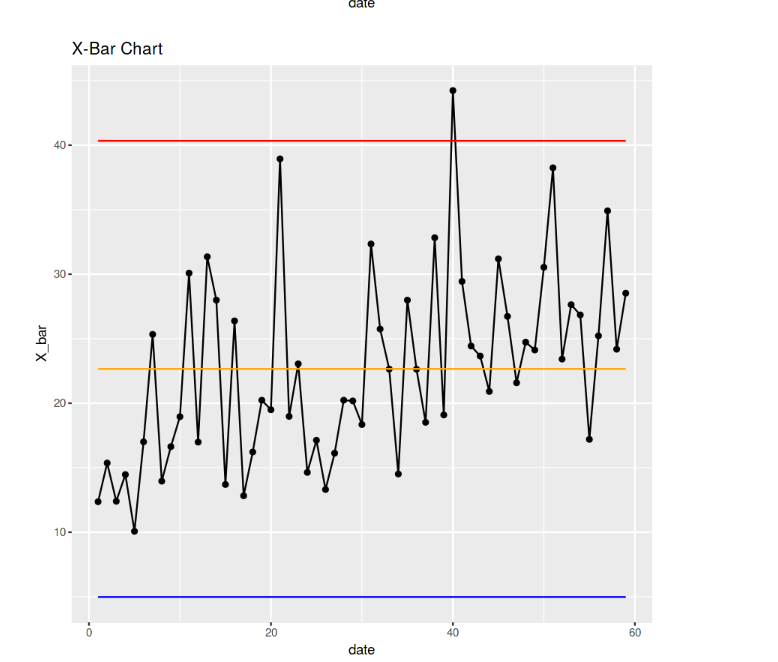
- Observe the two charts:
- Comment if you see any points beyond the control limits or close to them?
- Any trends or patterns suggesting an assignable cause of variation?
- Do you think there is an assignable cause of variation?
- Evaluate whether the cement production process in in control based on the control charts.
- In each chart, make sure to include UCL and LCL
- In the X-Bar chart include X double bar and in the R chart include R bar
Step by Step Solution
There are 3 Steps involved in it
Step: 1

Get Instant Access to Expert-Tailored Solutions
See step-by-step solutions with expert insights and AI powered tools for academic success
Step: 2

Step: 3
Ace Your Homework with AI
Get the answers you need in no time with our AI-driven, step-by-step assistance
Get Started
Linear Algebra With Applications
Authors: W. Keith Nicholson
7th Edition
978-0070985100, 70985103