Please use the sample template provided to record your answers.
Part I.
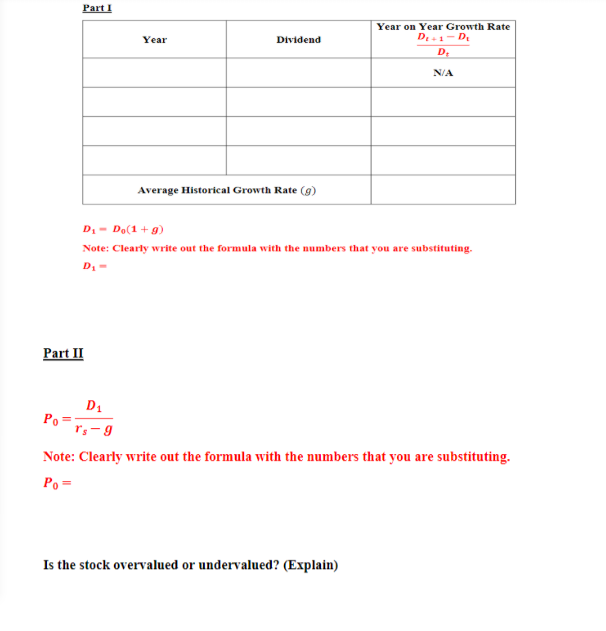
According to the constant growth dividend discount model, a stocks intrinsic value is equal to /(), where 1 is the expected annual dividend 1 year from now,is the stocks required rate of return, and g is the dividends constant growth rate. Suppose you wish to get an estimate of the dividend growth rate using the historical dividend information.
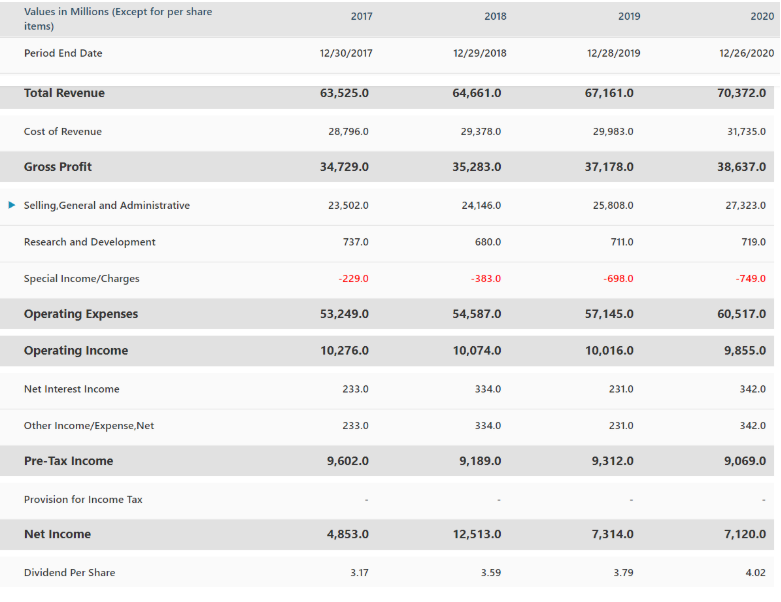
Using that information calculate the historical growth rate in the dividends for each of the last three years. Next calculate the average historical growth rate and use that as your estimate of the future growth rate (g). Next multiply the PepsiCos most recent annual dividend by 1+ to arrive at an estimate of1(assume that you are at t=0 now.)
Part II
The required return on equity,, is the final input needed to estimate intrinsic value. For our purpose,assume it is 12%. Having decided on your best estimates for 1,and g, you can now calculate PepsiCos intrinsic value. How does this estimate compare with the current stock price? Does your preliminary analysis using dividends suggest that PepsiCo is overvalued or undervalued? Explain.
Part III
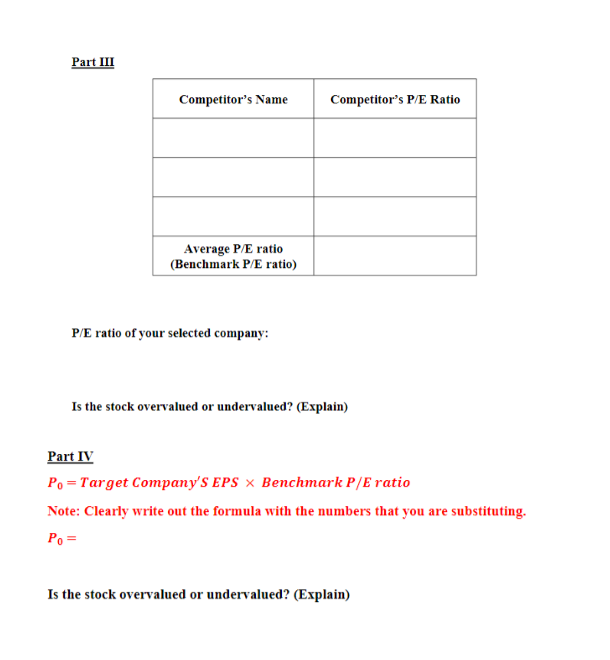
A common way of valuing stocks is using the P/E ratio. Suppose you want to select the average P/E ratio of PepsiCos competitors as the benchmark P/E ratio.
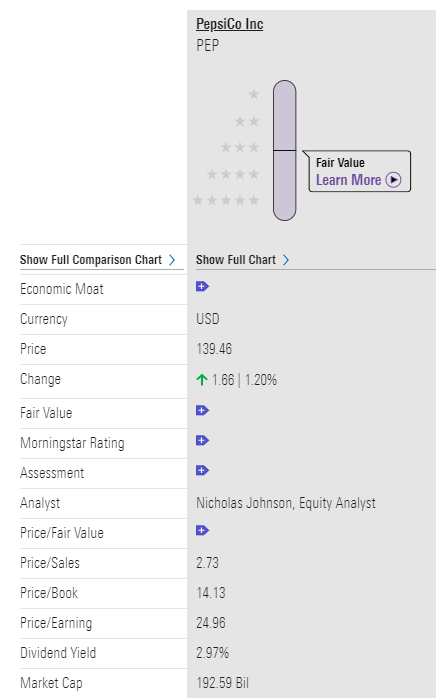
Create the benchmark P/E ratio for PepsiCo by taking the average of the competitor P/E ratios(Morningtar provides the data for three competitors. So, make sure to use the scroll bar at the bottom to get the data from all three competitors.) If you compare PepsiCos P/E ratio(look under PepsiCo on the same table with the competitor data to find this) with the benchmark P/E you calculated above, is the stock over valued or undervalued? Explain.
Part IV
Based on PepsiCos Trailing Twelve Month (TTM) Normalized Diluted EPS(look under Financials on Morningstar to find this)and the Benchmark P/E you calculated in part (iii) above, what should the PepsiCos fair price be? Based on this fair price and the current market price, is this stock overvalued or undervalued? Explain.
Here's the answer template
2017 2018 2019 2020 Values in Millions (Except for per share items) Period End Date 12/30/2017 12/29/2018 12/28/2019 12/26/2020 Total Revenue 63,525.0 64,661.0 67,161.0 70,372.0 Cost of Revenue 28,796.0 29,378.0 29,983.0 31,735.0 Gross Profit 34,729.0 35,283.0 37,178.0 38,637.0 Selling General and Administrative 23,502.0 24.146.0 25,808.0 27,323.0 Research and Development 737.0 680.0 711.0 719.0 Special Income/Charges -229.0 -383.0 -698.0 -749.0 Operating Expenses 53,249.0 54,587.0 57,145.0 60,517.0 Operating Income 10,276.0 10,074.0 10,016.0 9,855.0 Net Interest Income 233.0 334.0 231.0 342.0 Other Income/Expense, Net 233.0 334.0 231.0 342.0 Pre-Tax Income 9,602.0 9,189.0 9,312.0 9,069.0 Provision for Income Tax Net Income 4,853.0 12,513.0 7,314.0 7,120.0 Dividend Per Share 3.17 3.59 3.79 4.02 PepsiCo Inc PEP *** *** Fair Value Learn More Show Full Comparison Chart > Show Full Chart > Economic Moat Currency USD Price 139.46 Change 1.66 | 1.20% Fair Value Morningstar Rating Assessment Analyst Price/Fair Value Nicholas Johnson, Equity Analyst Price/Sales 2.73 14.13 Price/Book Price/Earning Dividend Yield 24.96 2.97% Market Cap 192.59 Bil Part 1 Year Dividend Year on Year Growth Rate DE+1-D D NA Average Historical Growth Rate (9) D. - Do(1+9) Note: Clearly write out the formula with the numbers that you are substituting. Part II D1 Po = rs-9 Note: Clearly write out the formula with the numbers that you are substituting. Po = Is the stock overvalued or undervalued? (Explain) Part III Competitor's Name Competitor's P/E Ratio Average P/E ratio (Benchmark P/E ratio) P/E ratio of your selected company: Is the stock overvalued or undervalued? (Explain) Part IV Po =Target Company's EPS X Benchmark P/E ratio Note: Clearly write out the formula with the numbers that you are substituting. Po= Is the stock overvalued or undervalued? (Explain) 2017 2018 2019 2020 Values in Millions (Except for per share items) Period End Date 12/30/2017 12/29/2018 12/28/2019 12/26/2020 Total Revenue 63,525.0 64,661.0 67,161.0 70,372.0 Cost of Revenue 28,796.0 29,378.0 29,983.0 31,735.0 Gross Profit 34,729.0 35,283.0 37,178.0 38,637.0 Selling General and Administrative 23,502.0 24.146.0 25,808.0 27,323.0 Research and Development 737.0 680.0 711.0 719.0 Special Income/Charges -229.0 -383.0 -698.0 -749.0 Operating Expenses 53,249.0 54,587.0 57,145.0 60,517.0 Operating Income 10,276.0 10,074.0 10,016.0 9,855.0 Net Interest Income 233.0 334.0 231.0 342.0 Other Income/Expense, Net 233.0 334.0 231.0 342.0 Pre-Tax Income 9,602.0 9,189.0 9,312.0 9,069.0 Provision for Income Tax Net Income 4,853.0 12,513.0 7,314.0 7,120.0 Dividend Per Share 3.17 3.59 3.79 4.02 PepsiCo Inc PEP *** *** Fair Value Learn More Show Full Comparison Chart > Show Full Chart > Economic Moat Currency USD Price 139.46 Change 1.66 | 1.20% Fair Value Morningstar Rating Assessment Analyst Price/Fair Value Nicholas Johnson, Equity Analyst Price/Sales 2.73 14.13 Price/Book Price/Earning Dividend Yield 24.96 2.97% Market Cap 192.59 Bil Part 1 Year Dividend Year on Year Growth Rate DE+1-D D NA Average Historical Growth Rate (9) D. - Do(1+9) Note: Clearly write out the formula with the numbers that you are substituting. Part II D1 Po = rs-9 Note: Clearly write out the formula with the numbers that you are substituting. Po = Is the stock overvalued or undervalued? (Explain) Part III Competitor's Name Competitor's P/E Ratio Average P/E ratio (Benchmark P/E ratio) P/E ratio of your selected company: Is the stock overvalued or undervalued? (Explain) Part IV Po =Target Company's EPS X Benchmark P/E ratio Note: Clearly write out the formula with the numbers that you are substituting. Po= Is the stock overvalued or undervalued? (Explain)


