please use these ratios. the last person did it wrong
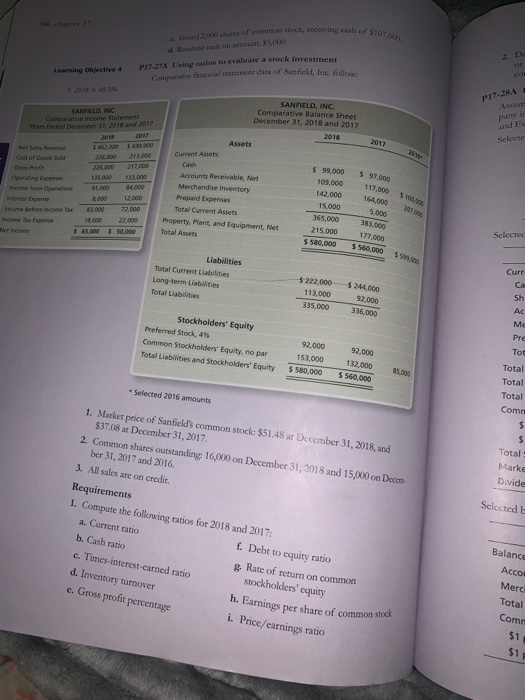
of $107.000 2. De Rich count 55.00 P17-27A Usingtos to evaluate #stock investmen Com e financial statement data of Sanfield, Inc. folie Learning Objective 1201848.9% P17-284 SAMMED, INC Comparative income statement Year Ended December 31, 2018 and 2017 SANFIELD, INC. Comparative Balance Sheet December 31, 2018 and 2017 2018 Assets 2017 Selecte Current Assets Cost of Goodi sold Grand Proce Operating perse Income the Operation 22.000 500.000 22.000 22000 225.000 217,000 35,000 33.000 1,000 6000 $97.000 $ 99,000 109,000 142.000 117.000 164.000 Accounts Receivable, Net Merchandise Inventory Prepaid Expenses Total Current Assets Property. Plant and Equipment, Net Total Assets Income Before income tax 83.000 72.000 Income Tax N000 22.000 Wet income 56.000 550,000 15,000 365,000 215.000 383,000 177,000 $560,000 Selected $ 580,000 Liabilities Total Current Liabilities Long-term Liabilities Total abilities Curr $ 222,000 113,000 335.000 $244.000 92.000 336,000 Stockholders' Equity Preferred Stock, 4% Common Stockholders' Equity, no par Total Liabilities and Stockholders' Equity 92,000 Pre Tot 92.000 153,000 S580,000 132.000 560.000 Total Total Total Com Total Marke Divide * Selected 2016 amounts 1. Market price of Sanfield's common stock: $51.48 ar December 31, 2018, and $37.08 at December 31, 2017 2. Common shares outstanding: 16,000 on December 31, 2018 and 15,000 on Decem ber 31, 2017 and 2016. 3. All sales are on credit. Requirements 1. Compute the following ratios for 2018 and 2017: a. Current ratio . Debt to equity ratio g. Rate of return on common c. Timcs-interest-earned ratio stockholders' cquity d. Inventory turnover h. Earnings per share of common stock e. Gross profit percentage i. Price/earnings ratio Selected t b. Cash ratio Balance ACCO Merc Total Com 51: nable to pay its dates Fyahating the ability to Dewi Smart Touch Learning from the pebt to city to . Too much debt. How do wetu Bos? If the debt ratio is too high, the company may be unable . Inability to collect receivables. Are days' sales in receive competitors? If so, a cash short may be looming . Buildup of merchandise inventories. Is inventory turno pany may be unable to sell goods, or it may be overstating mer Do any of these red flags apply to Smart Touch Learning in the chapter? Although the financial statements depict a stron The analysis pointed out several areas of weakness for Smart Touch low inventory turner, low accounts receivable turnover, low times interest earned, low asset turnover, and low carnings per shares ing should continue to carefully monitor its financial statements Exhibit 17. summarizes the financial ratios that you have learned in Timelineamed Evaluating profitability t Profit margin ratio Rate of return on Exhibit 17-8 Using Ratios in Financial Statement Analysis Asset tuover at Ratio Computation Information Provided Rate of return common holders Evaluating the ability to pay current abilities Working capital Current assets Current liabilities the n Earnings per share t A business's ability to meet obligations with its curre The company's ability to sabilities from cash and cash Cash ratio Cash Cash equivalents Evaluating stock as an invest Acid-test ratio Cash including cash equivalents. Short term investments + Net current receivables Total current liabilities Price learnings ratio receivables The company by to pay abtes if they came one The company's ability to pay liabilities from current Current ratio Total current assets Total current liabilities Dividend yield Dividend payout The following con 17-8 Us Ratios in Financial Statement Analysis Con Compuan ables. Sales, merch sales lead to high her inventory turne sales, merchandise in d for several years in to w is reporting a netko cash flow from operating any is in trouble. At the may face a cash shortage eo that of major competi AD185 horis recen pay its debts eing the ability to pay long term det t growing faster than for peberato Debt to equity ratio Total Total Tiesinterest earned so slow? If so, the com andise inventory om the analyses we did and growing company Learning that include ass profit margin, low Smart Touch Learn it continues to grow this chapter. Frating profitability Profit margin ratio Rate of return on total Aase turnover ratio Net sales Average total Provided Rate of return on Common stockholders' equity Net Income - P redvidends Average common these to common holders and the Earnings per share Net income-Preferred winds Weighted average number of common shares outstanding at its short-term at assets. Amount of a company's income each share of its outstanding common tok Evaluating stock as an investment ay current sh equivalents Pricelearnings ratio Market price per share of common stock Earnings per share The value the stock market places on sota company's earnings ay all its current mmediately Dividend yield Annual dividend per share Market price per share The percentage of a market value is returned annually as dividends to stockh current Dividend payout Annual dividend per share Earnings per share Ratio of dividends declared per common sh relative to the camins per than of the