Question
Please use Yahoo Finance The first yellow field is the stockholders equity reported on the last annual report released by the firm. You should enter
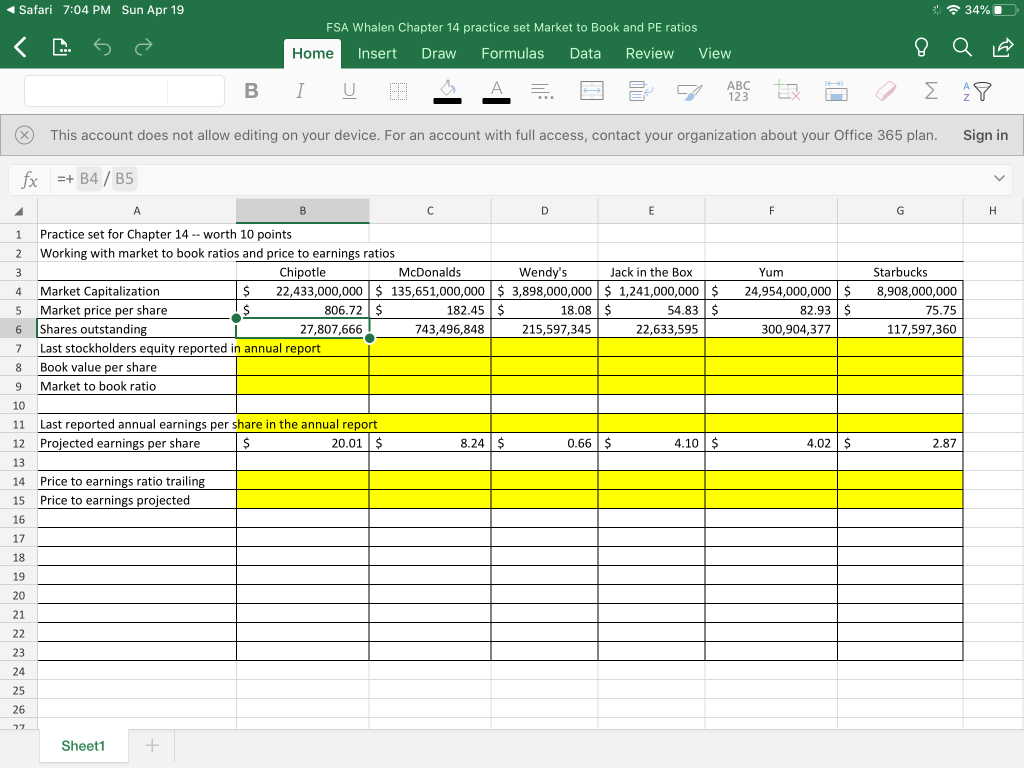
Please use Yahoo Finance The first yellow field is the stockholders equity reported on the last annual report released by the firm. You should enter this as a dollar amount. You can find this on the balance sheet.
The second yellow row of numbers is the book value per share and can be calculated by dividing the stockholders equity by the number of shares outstanding (that is supplied in the spreadsheet). This number is in dollars per share.
The third yellow field is the market value per share to the book value per share and is calculated by dividing the market price per share by the book value per share. Note that some of these numbers will be negative because the book values for some of these companies are negative.
The fourth yellow field is the last reported earnings per share as reported in the last annual report.
The next yellow field is the price to trailing earnings ratio which is calculated by taking the market price per share divided by the trailing earnings per share.
The last yellow field is the price to projected earnings ratio. This is calculated by dividing the market price per share by the projected earnings per share.
Safari 7:04 PM Sun Apr 19 34%D FSA Whalen Chapter 14 practice set Market to Book and PE ratios Home Insert Draw Formulas Data Review View 8 Q A BI U 3 A = 2 5 EZ [ 29 This account does not allow editing on your device. For an account with full access, contact your organization about your Office 365 plan. Sign in fx =+ B4 / B5 B Practice set for Chapter 14 -- worth 10 points Working with market to book ratios and price to earnings ratios Chipotle Market Capitalization $ 22,433,000,000 $ 135,651,000,000 $ 3,898,000,000 $1,241,000,000 $ Market price per share 1$ 806.72 $ 182.45 $ 18.08 $ 54.83 $ Shares outstanding 27,807,666 743,496,848 215,597,345 22,633,595 Last stockholders equity reported in annual report Book value per share Market to book ratio Yum 24,954,000,000 $ 82.93 $ 300,904,377 1 2 3 4 5 6 7 8 9 10 11 12 Starbucks 8,908,000,000 75.75 117,597,360 Last reported annual earnings per share in the annual report Projected earnings per share | $ 20.01 | $ 8.24 $ 0.66 $ 4.10 $ 4.02 $ 2.87 13 14 15 Price to earnings ratio trailing Price to earnings projected Sheet1 Safari 7:04 PM Sun Apr 19 34%D FSA Whalen Chapter 14 practice set Market to Book and PE ratios Home Insert Draw Formulas Data Review View 8 Q A BI U 3 A = 2 5 EZ [ 29 This account does not allow editing on your device. For an account with full access, contact your organization about your Office 365 plan. Sign in fx =+ B4 / B5 B Practice set for Chapter 14 -- worth 10 points Working with market to book ratios and price to earnings ratios Chipotle Market Capitalization $ 22,433,000,000 $ 135,651,000,000 $ 3,898,000,000 $1,241,000,000 $ Market price per share 1$ 806.72 $ 182.45 $ 18.08 $ 54.83 $ Shares outstanding 27,807,666 743,496,848 215,597,345 22,633,595 Last stockholders equity reported in annual report Book value per share Market to book ratio Yum 24,954,000,000 $ 82.93 $ 300,904,377 1 2 3 4 5 6 7 8 9 10 11 12 Starbucks 8,908,000,000 75.75 117,597,360 Last reported annual earnings per share in the annual report Projected earnings per share | $ 20.01 | $ 8.24 $ 0.66 $ 4.10 $ 4.02 $ 2.87 13 14 15 Price to earnings ratio trailing Price to earnings projected Sheet1Step by Step Solution
There are 3 Steps involved in it
Step: 1
Get Instant Access to Expert-Tailored Solutions
See step-by-step solutions with expert insights and AI powered tools for academic success
Step: 2
Step: 3
Ace Your Homework with AI
Get the answers you need in no time with our AI-driven, step-by-step assistance
Get Started