Please write a report on which project should Harris recommend or neither. In your report, you need to include quantitative analysis, including NPV, IRR, Payback and sensitivity analysis. You also need to include qualitative analysis including risk factors, long term impact of the project on the overall business, growth potentials, etc.
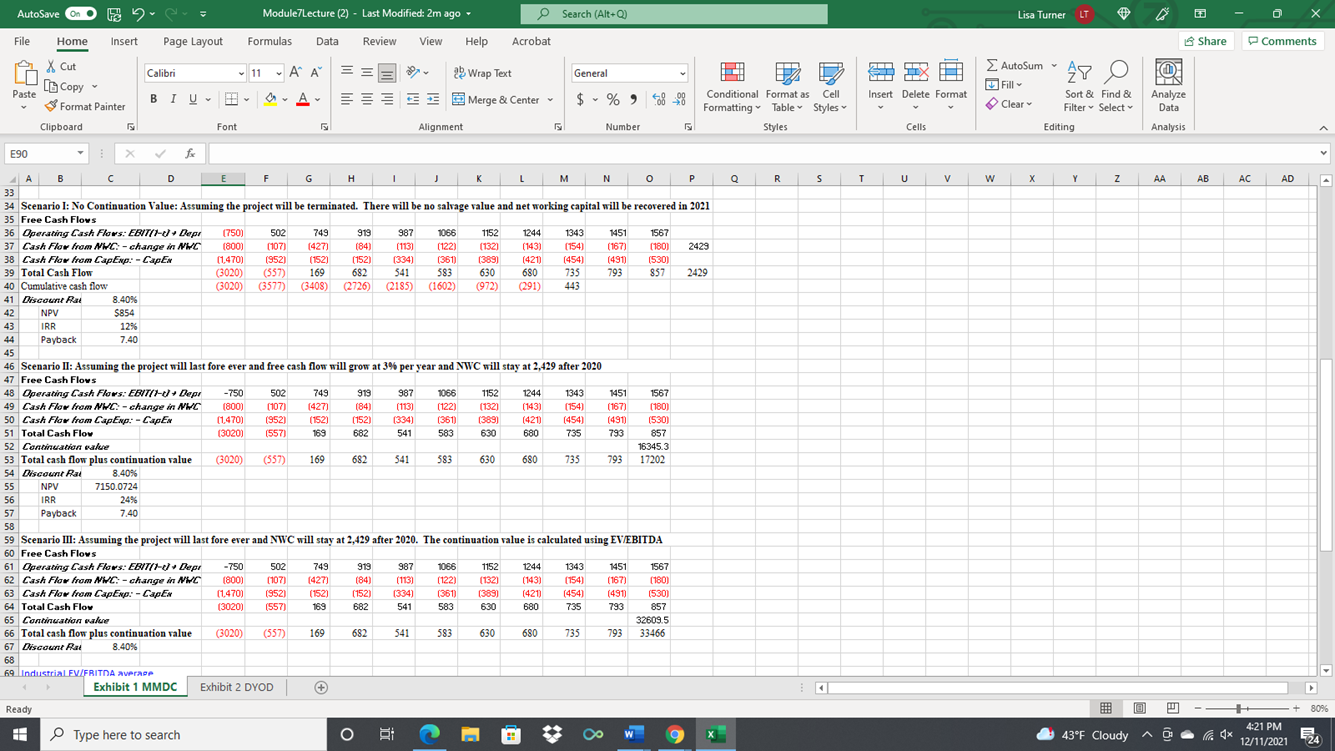
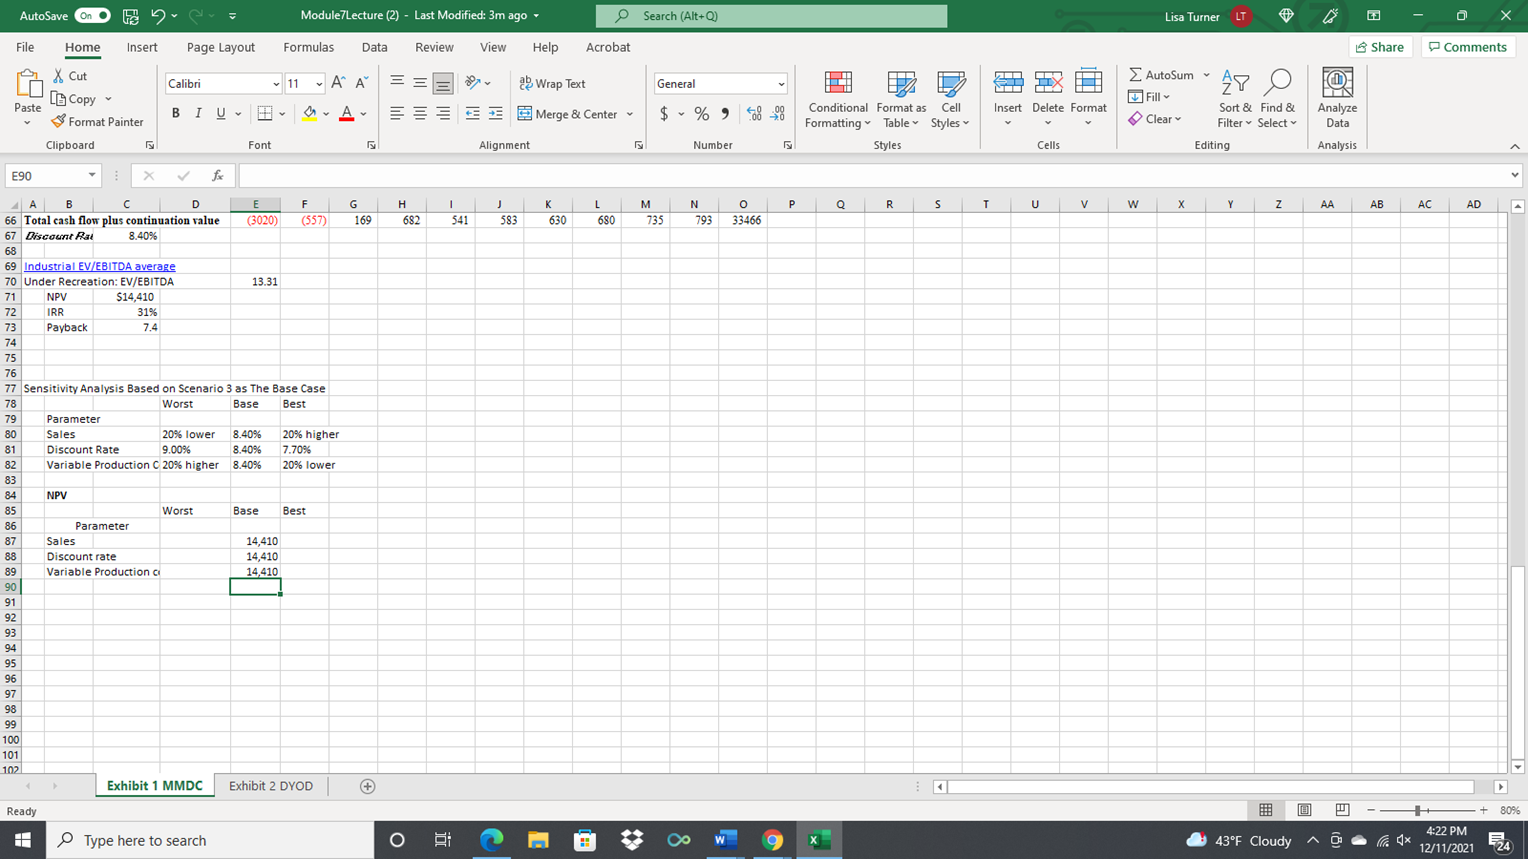
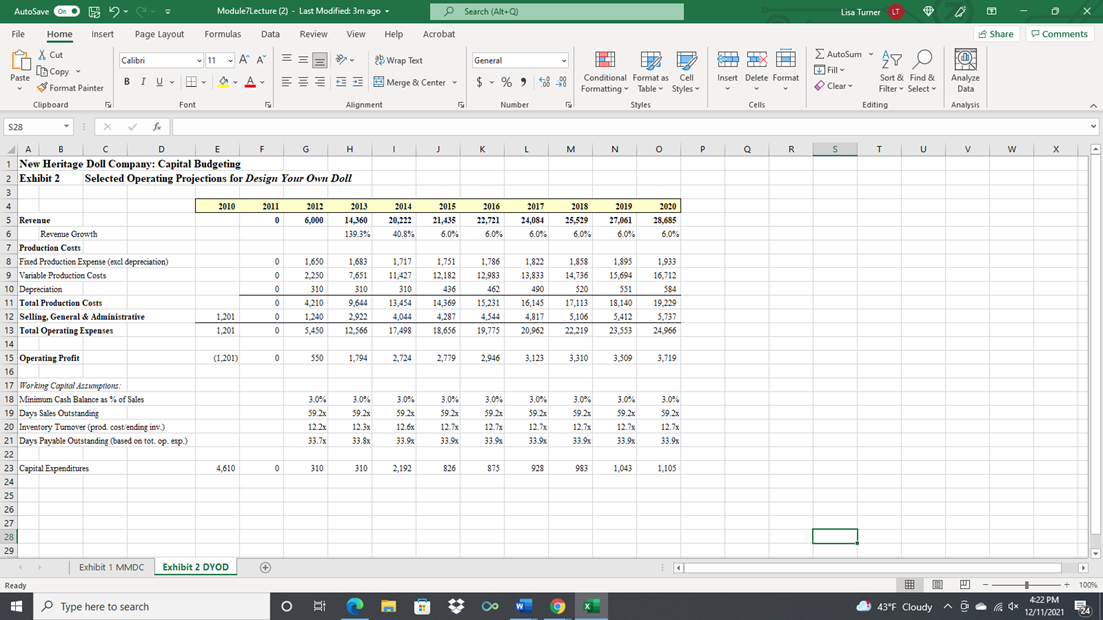
In Module7Lecture.xlsx, I have finished cash flows, NPV, IRR and Payback under three different scenarios. Please finish cash flow forecasting on the second project and calculating NPV, IRR and Payback for three scenarios as well. A sensitivity analysis parameters have been created for the first project. Please use the same parameters to construct sensitivity analysis for both projects.
Please write the report using the following template named Module7Template.docx and submit it on Blackboard. You can attach an Excel sheet as an appendix.
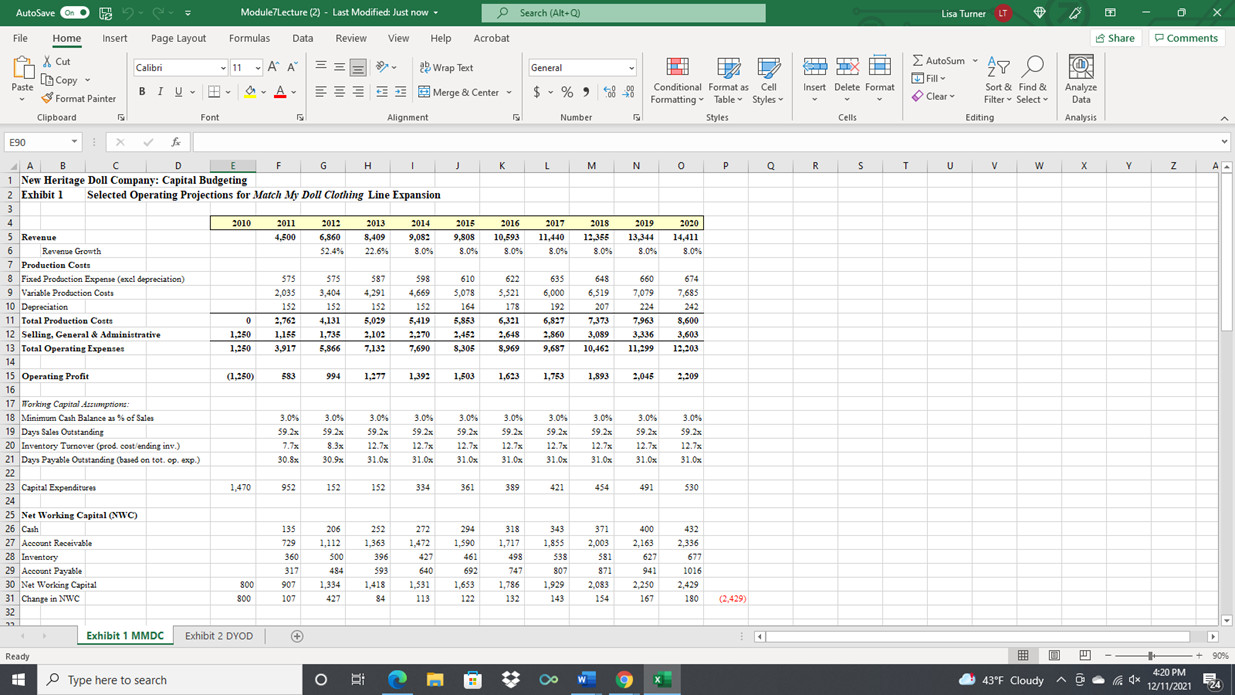
AutoSave On ModuleLecture (2) - Last Modified: Just now Search (Alt+Q) +Q Lisa Turner LT File Home Insert Page Layout Formulas Data Review View Help Acrobat Share Comments Calibri ab Wrap Text General ST IIX 11 AA = === ov Av AY O X Cut [b Copy ~ Paste Format Painter Clipboard BIU Insert Delete Format Merge & Center $ % 48 Conditional Format as Cell Formatting Table Styles Styles AutoSum Fill Sort & Find & Clear Filter Select Editing 0 Analyze Data Analysis Font Alignment Number Cells E90 J K L L M M N o P Q R s S T T U v w W Y Y Z A 2015 2020 2016 10,593 8.0% 9,808 8.0% 2017 11,440 8.0% 2018 12.355 8.0% 2019 13,344 8.0% 14,411 8.0% 660 7,079 610 3,078 164 5,853 2,452 8,305 622 3,521 178 6,321 2,648 8.969 635 6,000 192 6,827 2,860 9,687 648 6.519 207 7,373 3,089 10,462 224 7,963 674 7,685 242 8,600 3,603 12.203 3.336 11,299 1,503 1,623 1,763 1,893 2,045 2,209 A B C D F G H 1 1 New Heritage Doll Company: Capital Budgeting 2 Exhibit 1 Selected Operating Projections for Match My Doll Clothing Line Expansion 3 4 4 2010 2011 2012 2013 2014 5 Revenue 4,500 6,860 8,409 9,082 6 Revenue Growth 52.4% 22.6% 8.0% 7 Production Costs 8 Fixed Production Expense (exel depreciation) 575 575 587 598 9 Variable Production Costs 2,035 3.404 4.291 4,669 10 Depreciation 152 132 132 152 11 Total Production Costs 0 2,762 4.131 5,029 5.419 12 Selling. General & Administrative 1,250 1,186 1,735 2,102 2,270 13 Total Operating Expenses 1.250 3,917 5,866 7.132 7,690 14 15 Operating Profit (1.250) 583 994 1,277 1,392 16 17 Working Capital Assumptions: 18 Minimum Cash Balance 23% of Sales 3.0% 3.0% 3.0% 3.0% 19 Days Sales Outstanding 39.2x 39.2x 39.2x 39.2x 20 Inventory Turnover (prod. cost ending inv.) 7.7% 8.3% 12.7% 12.7% 21 Days Payable Outstanding (based on tot. op. exp.) 30.8% 30.9% 31.0x 31.0x 22 23 Capital Expenditures 1,470 952 152 152 334 24 25 Net Working Capital (NWC) 26 Cash 135 206 252 272 27 Account Receivable 729 1,112 1,363 1,472 28 Inventory 360 300 396 427 29 Account Payable 317 484 393 640 30 Net Working Capital 800 907 1,334 1,418 1,331 31 Change in NWC 800 107 427 84 113 32 3.0% 59.2x 12.7% 31.0x 3.0% 39.2x 12.7% 31.0x 3.0% 39.2x 12.7% 31.0x 3.0% 39.2x 12.7% 31.0x 3.0% 39.2x 12.7% 31.0% 3.0% 59.2x 12.7% 31.0x 361 389 421 454 491 530 318 1,717 498 294 1,590 461 692 1,633 122 343 1,855 538 807 1,929 143 371 2,003 381 871 2,083 154 400 2,163 627 941 2.250 167 432 2.336 677 1016 2,429 180 747 1,786 132 (2,429) Exhibit 1 MMDC Exhibit 2 DYOD Ready 90% Type here to search O BI 8 W X 43F Cloudy 4:20 PM 12/11/2021 EM 24 AutoSave On te Module7Lecture (2) - Last Modified: 2m ago O Search (Alt+Q) Lisa Turner LT File Home Insert Page Layout Formulas Data Review View Help Acrobat Share Comments 2 Wrap Text General H. X Cut LB Copy ~ 8 Format Painter Calibri BIU 11AA C-A- A AutoSum Fill Clear AY Sort & Find & Filter Select Paste Merge & Center $ %) Conditional Format as Cell Formatting Table Styles Styles Insert Delete Format F@ Analyze Data Analysis Clipboard Font Alignment Number 5 Cells Editing o R S T v w X Y Z AA AB AC AD E90 fx B B D F G H 1 K L M N o P 33 34 Scenario I: No Continuation Value: Assuming the project will be terminated. There will be no salvage value and net working capital will be recovered in 2021 35 Free Cash Flows 36 Operating Cash Flows: EBIT(1-0). Depi (750) 502 749 919 987 1066 1152 1244 1343 1451 1567 37 Cash Flow from NWC- change in NWC (800) (107) (427) (84) (113) (122) (132) (143) (154) (167) (180) 2429 38 Cash Flow from CapEnp. - CapEn (1.470) (952) (152) (152) (334) (361) (389) (421) (454) (491) (530) 39 Total Cash Flow (3020) (557) 169 682 541 583 630 680 735 793 857 2429 40 Cumulative cash flow (3020) (3577) (3408) (2726) (2185) (1602) (972) (291) 443 41 Discount Rai 8.40% 42 NPV $854 43 IRR 12% 44 Payback 7.40 45 46 Scenario II: Assuming the project will last fore ever and free cash flow will grow at 3% per year and NWC will stay at 2,429 after 2020 47 Free Cash Flows 48 Operating Cash Flows: EBIT11-11. Depi -750 502 749 919 987 1066 1152 1244 1343 1451 1567 49 Cash Flow from WC- change in WC (800) (107) ) (427) (84) (113) (122) (132) (143) (154) (167) (180) 50 Cash Flow From CapExp: - CapEx (1470) 1952) (152) (152) (334) (361) (389) (421) (454) (491) (530) 51 Total Cash Flow 13020) (557) 169 682 541 583 630 680 735 793 857 52 Continuation value 16345.3 53 Total cash flow plus continuation value (3020) (557) 169 682 541 583 630 680 735 793 17202 54 Discount Rai 8.40% 55 NPV 7150.0724 56 IRR 24% 57 Payback 7.40 58 59 Scenario III: Assuming the project will last fore ever and NWC will stay at 2,429 after 2020. The continuation value is calculated using EV/EBITDA 60 Free Cash Flows 61 Operating Cash Flows: EBIT/1-Depe -750 502 749 919 987 1066 1152 1244 1343 1451 1567 62 Cash Flor from WC: - change in WC (800) (107) (427) (84) (113) (122) (132) (143) (154) (167) (180) 63 Cash Flor from Cap Exp: - Cap Ex (1.470) 1952) (152) (152) (334) (361) (383) (421) (454) (491 (530) 64 Total Cash Flow (3020) (557) 169 682 541 583 630 680 735 793 857 65 Continuation value 32609.5 66 Total cash flow plus continuation value (3020) (557) 169 682 541 583 630 680 735 793 33466 67 Discount Ral 8.40% 68 69. Industrial EV/FRITDA NUPTADA Exhibit 1 MMDC 1 Exhibit 2 DYOD + Ready 80% HE Type here to search O 43F Cloudy A 4:21 PM 12/11/2021 AutoSave On Search (Alt+Q) 0 Lisa Turner LT X Module7Lecture (2) - Last Modified: 3m ago 2 Formulas Data Review View File Home Insert Page Layout Help Acrobat 3 Share Comments Calibri 11 AA = == Wrap Text General AL TIX 27 X Cut [Copy * Format Painter Paste BIU A 3 Merge & Center v Insert Delete Format $ %, 8 AutoSum Fill Sort & Find & Clear Filter Select Editing V Conditional Format as Cell Formatting Table Styles Styles Analyze Data Clipboard Font Alignment Number Cells Analysis E90 fx H P Q R R S s T U V w X Y Z AA AB AC AD G 169 1 541 K 630 L 680 M 735 N 793 o 33466 583 682 B B D D E F F 66 Total cash flow plus continuation value (3020) (557) 67 Discount Rai 8.40% 68 69 Industrial EV/EBITDA average 70 Under Recreation: EV/EBITDA 13.31 71 NPV $14,410 72 IRR 31% 73 15 Payback 7.4 74 75 76 77 Sensitivity Analysis Based on Scenario 3 as The Base Case 78 Worst Base Best 79 Parameter 80 Sales 20% lower 8.40% 20% higher 81 Discount Rate 9.00% 8.40% 7.70% 82 Variable Production C 20% higher 8.40% 20% lower 83 84 NPV 85 Worst Base Best 86 Parameter 87 87 Sales 14,410 88 Discount rate 14,410 89 Variable Production 14.410 90 91 92 93 94 95 96 97 98 os 99 100 101 102 Exhibit 1 MMDC Exhibit 2 DYOD o Ready W 80% Type here to search O O gi . & 43F Cloudy - O. 4:22 PM 12/11/2021 24 AutoSave On E Module/Lecture (2) - Last Modified: 3m ago Search (Alt+0) +Q Lisa Turner LT File Home Insert Page Layout Formulas Data Review View Help Acrobat Share Comments Calibri 11 ' ' " === 2 47 0 FO X Cut X LCopy ~ Paste Format Painter Clipboard 5 2 Wrap Text Merge & Center General $ % 88 BIU. -A- 3 Insert Delete Format Conditional Format as Cell Formatting Table Styles Styles AutoSum - Fill Sort & Find & Clear Filter Select Editing Analyze Data Font Alignment Number Cells Analysis S28 4 1 K L L M N 0 P Q R S T U v w 2014 20,222 40.8% 2015 21,435 6.0% 2016 22,721 6.0% 2017 24.084 6.0% 2018 25,529 6.0% 2019 27,061 6.0% 2020 28,685 6.0% % 1,717 11.427 310 13.454 4,044 17,498 1,751 12,182 436 14 369 4,287 18,656 1,786 12,983 462 15,231 4.544 19,775 1,822 13,833 490 16,145 4,817 20,962 1,858 14,736 520 17,113 5,106 22.219 1,895 15,694 551 18,140 5,412 23,553 1933 16,712 584 19.229 5,737 24.966 4A B D F G H 1 New Heritage Doll Company: Capital Budgeting 2 Exhibit 2 Selected Operating Projections for Design Your Own Doll 3 4 4 2010 2011 2012 2013 5 Revenue 0 6,000 14,360 6 Revenue Growth 139.3% 7 Production Costs 8 Fixed Production Expense (exel depreciation) 0 1.650 1,683 9 Variable Production Costs 0 0 2.250 7,651 10 Depreciation 0 310 310 11 Total Production Costs 0 4.210 9.644 12 Selling, General & Administrative 1,201 0 0 1.240 2.922 13 Total Operating Expenses 1.201 0 5,450 12.566 14 15 Operating Profit (1 201) 0 550 1,794 16 17 Working Capital Assumption 18 Minimum Cash Balance as % of Sales 3.0% 3.0% 19 Days Sales Outstanding 59.2x 59.2x 20 Inventory Tumover (prod. cost ending inv.) 12.2x 12.3x 21 Days Payable Outstanding (based on tot op. exp.) 33.7% 33.8x 22 23 Capital Expenditures 4,610 0 310 310 24 25 26 27 28 29 2,724 2,779 2,946 3,123 3,310 3,309 3,719 3.0% 59.2x 12.6% 33.9% 3.0% 592 12.7% 33.9 3,0% 59.2 12.7% 33.9x 3.0% 592 12.7 33.9x 3.0% 592 12.75 33.9x 3.0% 592 12.7 33.9 3.0% 59.2x 12.7% 33.9% 2,192 826 875 928 983 1,043 1,105 I Exhibit 1 MMDC Exhibit 2 DYOD Ready ELA Type here to search ORA + 100% 4:22 PM 12/11/2021 24 43F Cloudy A. F AutoSave On ModuleLecture (2) - Last Modified: Just now Search (Alt+Q) +Q Lisa Turner LT File Home Insert Page Layout Formulas Data Review View Help Acrobat Share Comments Calibri ab Wrap Text General ST IIX 11 AA = === ov Av AY O X Cut [b Copy ~ Paste Format Painter Clipboard BIU Insert Delete Format Merge & Center $ % 48 Conditional Format as Cell Formatting Table Styles Styles AutoSum Fill Sort & Find & Clear Filter Select Editing 0 Analyze Data Analysis Font Alignment Number Cells E90 J K L L M M N o P Q R s S T T U v w W Y Y Z A 2015 2020 2016 10,593 8.0% 9,808 8.0% 2017 11,440 8.0% 2018 12.355 8.0% 2019 13,344 8.0% 14,411 8.0% 660 7,079 610 3,078 164 5,853 2,452 8,305 622 3,521 178 6,321 2,648 8.969 635 6,000 192 6,827 2,860 9,687 648 6.519 207 7,373 3,089 10,462 224 7,963 674 7,685 242 8,600 3,603 12.203 3.336 11,299 1,503 1,623 1,763 1,893 2,045 2,209 A B C D F G H 1 1 New Heritage Doll Company: Capital Budgeting 2 Exhibit 1 Selected Operating Projections for Match My Doll Clothing Line Expansion 3 4 4 2010 2011 2012 2013 2014 5 Revenue 4,500 6,860 8,409 9,082 6 Revenue Growth 52.4% 22.6% 8.0% 7 Production Costs 8 Fixed Production Expense (exel depreciation) 575 575 587 598 9 Variable Production Costs 2,035 3.404 4.291 4,669 10 Depreciation 152 132 132 152 11 Total Production Costs 0 2,762 4.131 5,029 5.419 12 Selling. General & Administrative 1,250 1,186 1,735 2,102 2,270 13 Total Operating Expenses 1.250 3,917 5,866 7.132 7,690 14 15 Operating Profit (1.250) 583 994 1,277 1,392 16 17 Working Capital Assumptions: 18 Minimum Cash Balance 23% of Sales 3.0% 3.0% 3.0% 3.0% 19 Days Sales Outstanding 39.2x 39.2x 39.2x 39.2x 20 Inventory Turnover (prod. cost ending inv.) 7.7% 8.3% 12.7% 12.7% 21 Days Payable Outstanding (based on tot. op. exp.) 30.8% 30.9% 31.0x 31.0x 22 23 Capital Expenditures 1,470 952 152 152 334 24 25 Net Working Capital (NWC) 26 Cash 135 206 252 272 27 Account Receivable 729 1,112 1,363 1,472 28 Inventory 360 300 396 427 29 Account Payable 317 484 393 640 30 Net Working Capital 800 907 1,334 1,418 1,331 31 Change in NWC 800 107 427 84 113 32 3.0% 59.2x 12.7% 31.0x 3.0% 39.2x 12.7% 31.0x 3.0% 39.2x 12.7% 31.0x 3.0% 39.2x 12.7% 31.0x 3.0% 39.2x 12.7% 31.0% 3.0% 59.2x 12.7% 31.0x 361 389 421 454 491 530 318 1,717 498 294 1,590 461 692 1,633 122 343 1,855 538 807 1,929 143 371 2,003 381 871 2,083 154 400 2,163 627 941 2.250 167 432 2.336 677 1016 2,429 180 747 1,786 132 (2,429) Exhibit 1 MMDC Exhibit 2 DYOD Ready 90% Type here to search O BI 8 W X 43F Cloudy 4:20 PM 12/11/2021 EM 24 AutoSave On te Module7Lecture (2) - Last Modified: 2m ago O Search (Alt+Q) Lisa Turner LT File Home Insert Page Layout Formulas Data Review View Help Acrobat Share Comments 2 Wrap Text General H. X Cut LB Copy ~ 8 Format Painter Calibri BIU 11AA C-A- A AutoSum Fill Clear AY Sort & Find & Filter Select Paste Merge & Center $ %) Conditional Format as Cell Formatting Table Styles Styles Insert Delete Format F@ Analyze Data Analysis Clipboard Font Alignment Number 5 Cells Editing o R S T v w X Y Z AA AB AC AD E90 fx B B D F G H 1 K L M N o P 33 34 Scenario I: No Continuation Value: Assuming the project will be terminated. There will be no salvage value and net working capital will be recovered in 2021 35 Free Cash Flows 36 Operating Cash Flows: EBIT(1-0). Depi (750) 502 749 919 987 1066 1152 1244 1343 1451 1567 37 Cash Flow from NWC- change in NWC (800) (107) (427) (84) (113) (122) (132) (143) (154) (167) (180) 2429 38 Cash Flow from CapEnp. - CapEn (1.470) (952) (152) (152) (334) (361) (389) (421) (454) (491) (530) 39 Total Cash Flow (3020) (557) 169 682 541 583 630 680 735 793 857 2429 40 Cumulative cash flow (3020) (3577) (3408) (2726) (2185) (1602) (972) (291) 443 41 Discount Rai 8.40% 42 NPV $854 43 IRR 12% 44 Payback 7.40 45 46 Scenario II: Assuming the project will last fore ever and free cash flow will grow at 3% per year and NWC will stay at 2,429 after 2020 47 Free Cash Flows 48 Operating Cash Flows: EBIT11-11. Depi -750 502 749 919 987 1066 1152 1244 1343 1451 1567 49 Cash Flow from WC- change in WC (800) (107) ) (427) (84) (113) (122) (132) (143) (154) (167) (180) 50 Cash Flow From CapExp: - CapEx (1470) 1952) (152) (152) (334) (361) (389) (421) (454) (491) (530) 51 Total Cash Flow 13020) (557) 169 682 541 583 630 680 735 793 857 52 Continuation value 16345.3 53 Total cash flow plus continuation value (3020) (557) 169 682 541 583 630 680 735 793 17202 54 Discount Rai 8.40% 55 NPV 7150.0724 56 IRR 24% 57 Payback 7.40 58 59 Scenario III: Assuming the project will last fore ever and NWC will stay at 2,429 after 2020. The continuation value is calculated using EV/EBITDA 60 Free Cash Flows 61 Operating Cash Flows: EBIT/1-Depe -750 502 749 919 987 1066 1152 1244 1343 1451 1567 62 Cash Flor from WC: - change in WC (800) (107) (427) (84) (113) (122) (132) (143) (154) (167) (180) 63 Cash Flor from Cap Exp: - Cap Ex (1.470) 1952) (152) (152) (334) (361) (383) (421) (454) (491 (530) 64 Total Cash Flow (3020) (557) 169 682 541 583 630 680 735 793 857 65 Continuation value 32609.5 66 Total cash flow plus continuation value (3020) (557) 169 682 541 583 630 680 735 793 33466 67 Discount Ral 8.40% 68 69. Industrial EV/FRITDA NUPTADA Exhibit 1 MMDC 1 Exhibit 2 DYOD + Ready 80% HE Type here to search O 43F Cloudy A 4:21 PM 12/11/2021 AutoSave On Search (Alt+Q) 0 Lisa Turner LT X Module7Lecture (2) - Last Modified: 3m ago 2 Formulas Data Review View File Home Insert Page Layout Help Acrobat 3 Share Comments Calibri 11 AA = == Wrap Text General AL TIX 27 X Cut [Copy * Format Painter Paste BIU A 3 Merge & Center v Insert Delete Format $ %, 8 AutoSum Fill Sort & Find & Clear Filter Select Editing V Conditional Format as Cell Formatting Table Styles Styles Analyze Data Clipboard Font Alignment Number Cells Analysis E90 fx H P Q R R S s T U V w X Y Z AA AB AC AD G 169 1 541 K 630 L 680 M 735 N 793 o 33466 583 682 B B D D E F F 66 Total cash flow plus continuation value (3020) (557) 67 Discount Rai 8.40% 68 69 Industrial EV/EBITDA average 70 Under Recreation: EV/EBITDA 13.31 71 NPV $14,410 72 IRR 31% 73 15 Payback 7.4 74 75 76 77 Sensitivity Analysis Based on Scenario 3 as The Base Case 78 Worst Base Best 79 Parameter 80 Sales 20% lower 8.40% 20% higher 81 Discount Rate 9.00% 8.40% 7.70% 82 Variable Production C 20% higher 8.40% 20% lower 83 84 NPV 85 Worst Base Best 86 Parameter 87 87 Sales 14,410 88 Discount rate 14,410 89 Variable Production 14.410 90 91 92 93 94 95 96 97 98 os 99 100 101 102 Exhibit 1 MMDC Exhibit 2 DYOD o Ready W 80% Type here to search O O gi . & 43F Cloudy - O. 4:22 PM 12/11/2021 24 AutoSave On E Module/Lecture (2) - Last Modified: 3m ago Search (Alt+0) +Q Lisa Turner LT File Home Insert Page Layout Formulas Data Review View Help Acrobat Share Comments Calibri 11 ' ' " === 2 47 0 FO X Cut X LCopy ~ Paste Format Painter Clipboard 5 2 Wrap Text Merge & Center General $ % 88 BIU. -A- 3 Insert Delete Format Conditional Format as Cell Formatting Table Styles Styles AutoSum - Fill Sort & Find & Clear Filter Select Editing Analyze Data Font Alignment Number Cells Analysis S28 4 1 K L L M N 0 P Q R S T U v w 2014 20,222 40.8% 2015 21,435 6.0% 2016 22,721 6.0% 2017 24.084 6.0% 2018 25,529 6.0% 2019 27,061 6.0% 2020 28,685 6.0% % 1,717 11.427 310 13.454 4,044 17,498 1,751 12,182 436 14 369 4,287 18,656 1,786 12,983 462 15,231 4.544 19,775 1,822 13,833 490 16,145 4,817 20,962 1,858 14,736 520 17,113 5,106 22.219 1,895 15,694 551 18,140 5,412 23,553 1933 16,712 584 19.229 5,737 24.966 4A B D F G H 1 New Heritage Doll Company: Capital Budgeting 2 Exhibit 2 Selected Operating Projections for Design Your Own Doll 3 4 4 2010 2011 2012 2013 5 Revenue 0 6,000 14,360 6 Revenue Growth 139.3% 7 Production Costs 8 Fixed Production Expense (exel depreciation) 0 1.650 1,683 9 Variable Production Costs 0 0 2.250 7,651 10 Depreciation 0 310 310 11 Total Production Costs 0 4.210 9.644 12 Selling, General & Administrative 1,201 0 0 1.240 2.922 13 Total Operating Expenses 1.201 0 5,450 12.566 14 15 Operating Profit (1 201) 0 550 1,794 16 17 Working Capital Assumption 18 Minimum Cash Balance as % of Sales 3.0% 3.0% 19 Days Sales Outstanding 59.2x 59.2x 20 Inventory Tumover (prod. cost ending inv.) 12.2x 12.3x 21 Days Payable Outstanding (based on tot op. exp.) 33.7% 33.8x 22 23 Capital Expenditures 4,610 0 310 310 24 25 26 27 28 29 2,724 2,779 2,946 3,123 3,310 3,309 3,719 3.0% 59.2x 12.6% 33.9% 3.0% 592 12.7% 33.9 3,0% 59.2 12.7% 33.9x 3.0% 592 12.7 33.9x 3.0% 592 12.75 33.9x 3.0% 592 12.7 33.9 3.0% 59.2x 12.7% 33.9% 2,192 826 875 928 983 1,043 1,105 I Exhibit 1 MMDC Exhibit 2 DYOD Ready ELA Type here to search ORA + 100% 4:22 PM 12/11/2021 24 43F Cloudy A. F