Answered step by step
Verified Expert Solution
Question
1 Approved Answer
please write it as simple as you can use #include(fstream ) #include(iomanip) setwidhh, set preciaion functions for coding Write a program to read in the

please write it as simple as you can use #include(fstream ) #include(iomanip) setwidhh, set preciaion functions for coding
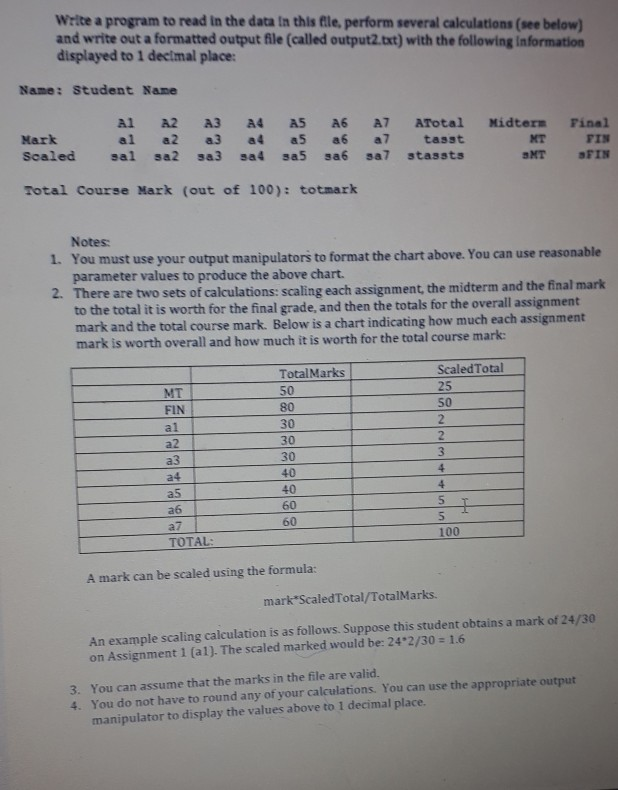
Write a program to read in the data in this file, perform several calculations (see below) and write out a formatted output file (called output2.txt) with the following information displayed to 1 decimal place: Name: Student Name a1 A2 A3 A4 A5 A6 A7 ATotal Mark ala2 a3 a4 a5 a6 a7 tasst Scaled salsa2 a3 a4 a5 s6 sal stassts Total Course Mark (out of 100): totmark! Midterm XT SKT Final FIN SFIN Notes 1. You must use your output manipulators to format the chart above. You can use reasonable parameter values to produce the above chart. 2. There are two sets of calculations: scaling each assignment, the midterm and the final mark to the total it is worth for the final grade, and then the totals for the overall assignment mark and the total course mark. Below is a chart indicating how much each assignment mark is worth overall and how much it is worth for the total course mark: MT FIN TotalMarks 50 80 30 Scaled Total 25 50 2 al a2 a3 a4 a5 - 40 a6605 a7 605 TOTAL: 100 A mark can be scaled using the formula: mark Scaled Total/TotalMarks. An example scaling calculation is as follows. Suppose this student obtains a mark of 24/30 on Assignment 1 (al). The scaled marked would be: 24*2/30 = 1.6 3. You can assume that the marks in the file are valid. 4. You do not have to round any of your calculations. You can use the appropriate output manipulator to display the values above to 1 decimal place, Write a program to read in the data in this file, perform several calculations (see below) and write out a formatted output file (called output2.txt) with the following information displayed to 1 decimal place: Name: Student Name a1 A2 A3 A4 A5 A6 A7 ATotal Mark ala2 a3 a4 a5 a6 a7 tasst Scaled salsa2 a3 a4 a5 s6 sal stassts Total Course Mark (out of 100): totmark! Midterm XT SKT Final FIN SFIN Notes 1. You must use your output manipulators to format the chart above. You can use reasonable parameter values to produce the above chart. 2. There are two sets of calculations: scaling each assignment, the midterm and the final mark to the total it is worth for the final grade, and then the totals for the overall assignment mark and the total course mark. Below is a chart indicating how much each assignment mark is worth overall and how much it is worth for the total course mark: MT FIN TotalMarks 50 80 30 Scaled Total 25 50 2 al a2 a3 a4 a5 - 40 a6605 a7 605 TOTAL: 100 A mark can be scaled using the formula: mark Scaled Total/TotalMarks. An example scaling calculation is as follows. Suppose this student obtains a mark of 24/30 on Assignment 1 (al). The scaled marked would be: 24*2/30 = 1.6 3. You can assume that the marks in the file are valid. 4. You do not have to round any of your calculations. You can use the appropriate output manipulator to display the values above to 1 decimal placeStep by Step Solution
There are 3 Steps involved in it
Step: 1

Get Instant Access to Expert-Tailored Solutions
See step-by-step solutions with expert insights and AI powered tools for academic success
Step: 2

Step: 3

Ace Your Homework with AI
Get the answers you need in no time with our AI-driven, step-by-step assistance
Get Started


