

Answered step by step
Verified Expert Solution
Question
1 Approved Answer
pleasee answer each question pls Introduction Let us assume thit you are the Marketing Manager responsible for your company's Strategie Marketing Plan. You company is
pleasee answer each question pls 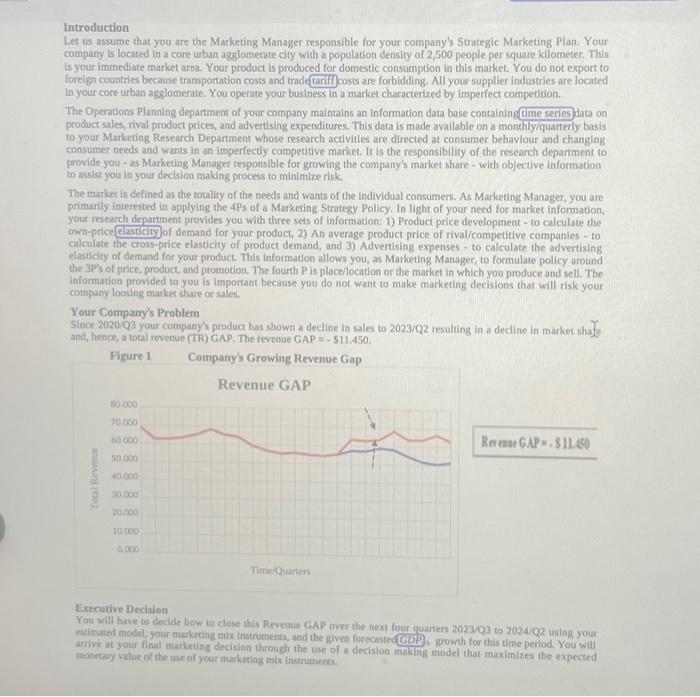
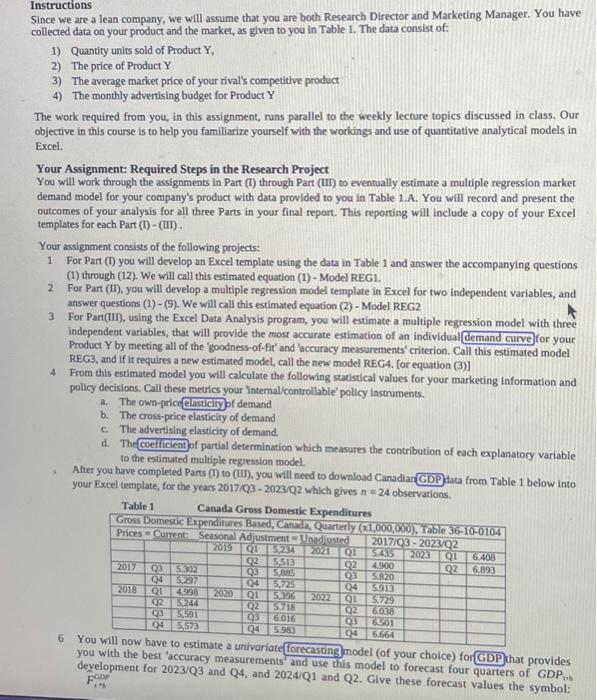
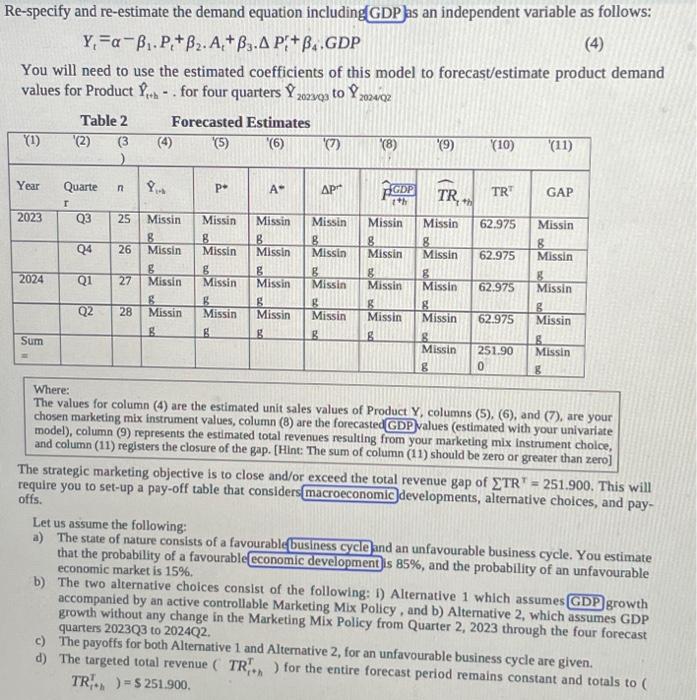
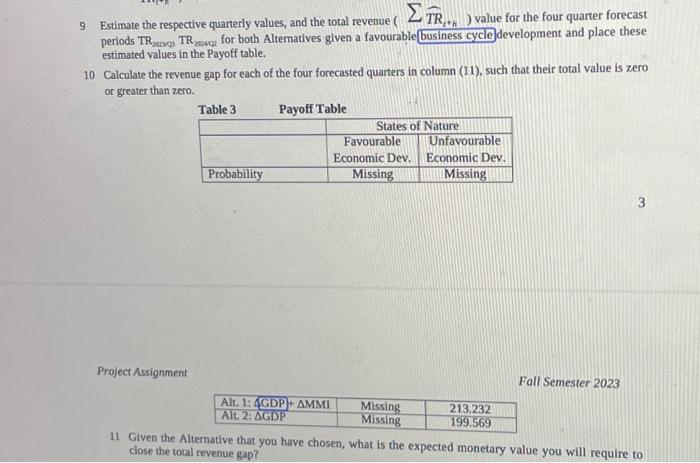
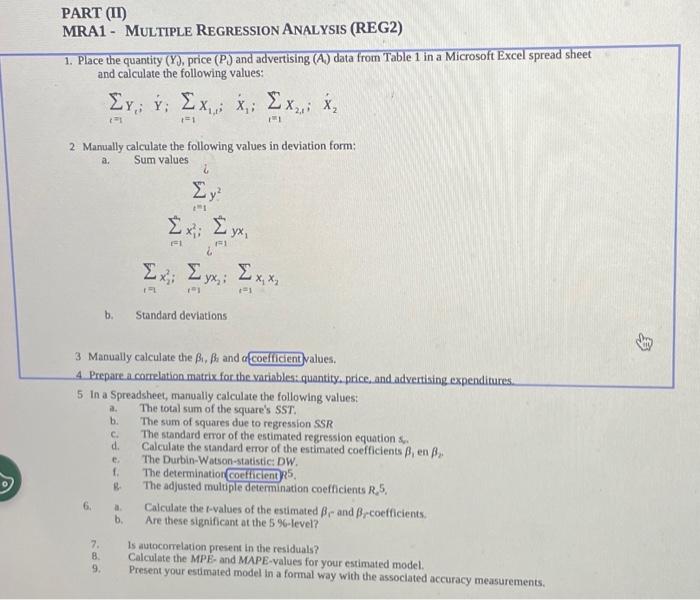
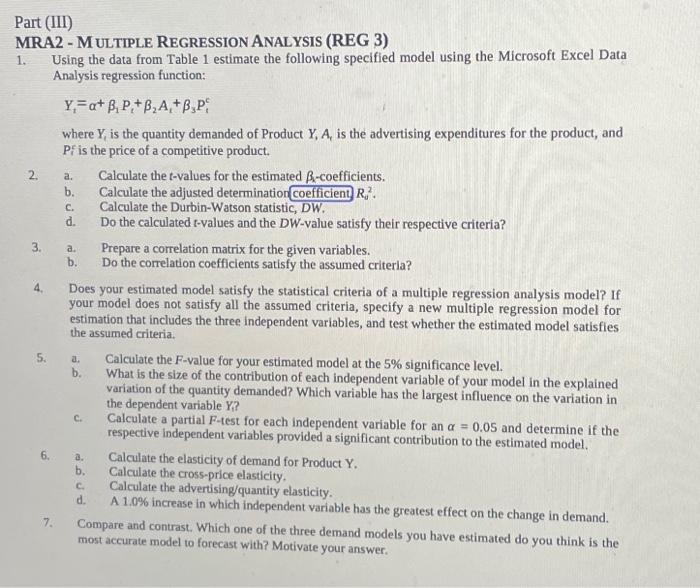
Introduction Let us assume thit you are the Marketing Manager responsible for your company's Strategie Marketing Plan. You company is located in a core urban agglomenate cly with a population density of 2,500 people per square kllometer. This is your immediete market ares. Your product is produced for domestic consumption in this market. You do not export to foreign countries because tramportation costs and trade(taniff) costs are forbidding. All your supplier industries are located The Opentions Planing department of your company maintains an information data base containing data on product sales, rival product prices, and advertising expenditures. This data is made available on a monthly/quarterly basis to your Marketing Research Department whose research activitles are directed at consumer behaviour and changing consumer needs and wants in an imperfectly competitive market. It is the responsibility of the research department to provide you - as Marketing Manager respotsible for growing the company's market share - with objective information to assist you in your dectsion making process to minimize risk. The market is defined as the totality of the needs and wants of the individual consumers. As Marketing Manager, you are primarily interested in applying the 4Ps of a Marketing Strategy Policy. In light of your need for market information, your research department provides you with three sets of information -1) Product price development - to caleulate the own-price elastidityof demand for your product, 2) An average product price of rival/competitive companies - to calculate the cois-price elasticty of product demand, and 3) Advertising expenses - to calculate the advertising elasdicty of demand for your product. This information allows you, as Marketing Manager, to formulate policy around the 3P's of price, product, and promotion. The fourth P is place/location or the market in which you produce and sell. The information provided to you is important because you do not want to make marketing decisions that will risk your company loosing market thare or sales. Your Company's Problem Since 2020/Q3 your company's product has shown a decline in sales to 2023/Q2 resulting in a decline in market ahafe and, hence, o tonel revente (TR) CAP. The revenue GAP =$11.450. Executive Decision You will have to decide I ow to close this Revemue GAP over the noxt four quarters 202303 to 2024/Q2 usiog you arme at your final marketing decision through the use of a decision making model that maximizes the expected monetuy value of the use of your marknting mix instruments. Instructions Since we are a lean company, we will assume that you are both Research Director and Marketing Manager. You have collected data on your product and the market, as given to you in Table 1 . The data consist of: 1) Quantity units sold of Product Y, 2) The price of Product Y 3) The average market price of your dival's competitive product 4) The monthly advertising budget for Product Y The work required from you, in this assignment, runs parallel to the weekly lecture topics discussed in class. Our objective in this course is to help you familiarize yourself with the workings and use of quantitative analytical models in Excel. Your Assignment: Required Steps in the Research Project You will work through the assignments in Part (I) through Part (III) to eventually estimate a multiple regression market demand model for your company's product with data provided to you in Table 1.A. You will record and present the outcomes of your analysis for all three Parts in your final report. This reporting will include a copy of your Excel templates for each Part (I) - (III). Your assignment consists of the following projects: 1 For Part (I) you will develop an Excel template using the data in Table 1 and answer the accompanying questions (1) through (12). We will call this estimated equation (1) - Model REG1. 2. For Part (II), you will develop a multiple regression model template in Excel for two independent variables, and answer questions (1) - (9). We will call this estimated equation (2) - Model REG2 3 For Part(III), using the Excel Data Analysis program, you will estimate a multiple regression model with three independent variables, that will provide the most accurate estimation of an individual for your Product Y by meeting all of the 'goodness-of-fit' and 'accuracy measurements' criterion. Call this estimated model REG3, and if it requires a new estimated model, call the new model REG4. [or equation (3)] 4 From this estimated model you will calculate the following statistical values for your marketing information and policy decisions. Call these metrics your Internal/controllable' policy instruments. 2. The own-price elasticingt demand b. The cross-price elasticity of demand c. The advertising elasticity of demand. d. The coefficient of partial determination which measures the contribution of each explanatory variable to the estimated multiple regression model. 3. After you have completed Parts (i) to (iii), you will need to download Canadiar(GDP) tata from Table 1 below into your Excel tetaplate, for the years 2017/Q32023/Q2 which gives n=24 observations. 6 You you with the best 'accuracy a univariatef forecasting) model (of your choice) for (GDP) that provides development for 2023/Q3 a measurements and use this model to forecast four quarters of GDP Ft+h Yt=1,Pt+2,At+3Ptr+4,GDP You will need to use the estimated coefficients of this model to forecast/estimate product demand values for Product Y^ith. for four quarters Y^202393 to Y^202402 Where: The values for column (4) are the estimated unit sales values of Product Y, columns (5), (6), and (7), are your chosen marketing mix instrument values, column (8) are the forecasted (GDP) values (estimated with your univariate model), column ( 9 ) represents the estimated total revenues resulting from your marketing mix instrument choice, and column (11) registers the closure of the gap. [Hint: The sum of column (11) should be zero or greater than zero] The strategic marketing objective is to close and/or exceed the total revenue gap of TT=251.900. This will require you to set-up a pay-off table that considers developments, alternative cholces, and payoffs. Let us assume the following: a) The state of nature consists of a favourable that the probability of a favourable and an unfavourable business cycle. You estimate economic market is 15%. is 85%, and the probability of an unfavourable b) The two alternative choices consist of the following: i) Alternative 1 which assumes GDP growth accompanied by an active controllable Marketing Mix Policy, and b) Alternative 2, which assumes GDP growth without any change in the Marketing Mix Policy from Quarter 2, 2023 through the four forecast quarters 2023 Q3 to 2024 Q2. c) The payoffs for both Altemative 1 and Altemative 2, for an unfavourable business cycle are given. d) The targeted total revenue (TRr+hT) for the entire forecast period remains constant and totals to ( TRi+hT)=$251.900 PART (II) MRA1 - Multiple Regression ANALysis (REG2) 1. Place the quantity (Y0), price (P) and advertising (A1) data from Table 1 in a Microsoft Excel spread sheet and calculate the following values: i=1Yi;Yii=1X1,i;X1;i=1X2,i;X2 2 Manually calculate the following values in deviation form: a. Sum values i i=1my2i=1nx12;i=1nyx1i=1x22;i=1yx2;i=1x1x2 b. Standard deviations 3 Manually calculate the 1,i and a values. 4. Prepare a correlation matrix for the variables: quantity, price, and advertising expenditures. 5 in a Spreadsheet, manually calculate the following values: a. The total sum of the square's SST. b. The sum of squares due to regression SSR c. The standard eror of the estimated regression equation s. d. Calculate the standard error of the estimated coefficients 1 en 2. e. The Durbin-Watson-statistic: DW. f. The determination 85 . g. The adjusted mulople determination coefficients R25. 6. a. Calculate the t-values of the estimated r and r-coefficients. b. Are these significant at the 5%-level? 7. Is autocorrelation present in the residuals? 8. Calculate the MPE- and MAPE-values for your estimated model. 9. Present your estimated model in a formal way with the associated accuracy measurements. Part (III) MRA2 - M ULTIPLE REGRESSION ANALYSIS (REG 3) 1. Using the data from Table 1 estimate the following specified model using the Microsoft Excel Data Analysis regression function: Yt=+1Pt+2At+3Ptc where Y, is the quantity demanded of Product Y,A, is the advertising expenditures for the product, and Pf is the price of a competitive product. 2. a. Calculate the t-values for the estimated -coefficients. b. Calculate the adjusted determination coefficient Rd2. c. Calculate the Durbin-Watson statistic, DW. d. Do the calculated t-values and the DW-value satisfy their respective criteria? 3. a. Prepare a correlation matrix for the given variables. b. Do the correlation coefficients satisfy the assumed criterla? 4. Does your estimated model satisfy the statistical criteria of a multiple regression analysis model? If your model does not satisfy all the assumed criteria, specify a new multiple regression model for estimation that includes the three independent variables, and test whether the estimated model satisfies the assumed criteria. 5. a. Calculate the F-value for your estimated model at the 5% significance level. b. What is the size of the contribution of each independent variable of your model in the explained variation of the quantity demanded? Which variable has the largest influence on the variation in the dependent variable Y ? c. Calculate a partial F-test for each independent variable for an =0.05 and determine if the respective independent variables provided a significant contribution to the estimated model. 6. a. Calculate the elasticity of demand for Product Y. b. Calculate the cross-price elasticity. c. Calculate the advertising/quantity elasticity. d. A 1.0% increase in which independent variable has the greatest effect on the change in demand. 7. Compare and contrast. Which one of the three demand models you have estimated do you think is the most accurate model to forecast with? Motivate your Step by Step Solution
There are 3 Steps involved in it
Step: 1

Get Instant Access to Expert-Tailored Solutions
See step-by-step solutions with expert insights and AI powered tools for academic success
Step: 2

Step: 3
Ace Your Homework with AI
Get the answers you need in no time with our AI-driven, step-by-step assistance
Get Started
Quantitative Methods For Business
Authors: David Anderson, Dennis Sweeney, Thomas Williams, Jeffrey Cam
11th Edition
978-0324651812, 324651813, 978-0324651751