 PLEASE,USE MATLAB TO SOLVE THESE QUESTIONS
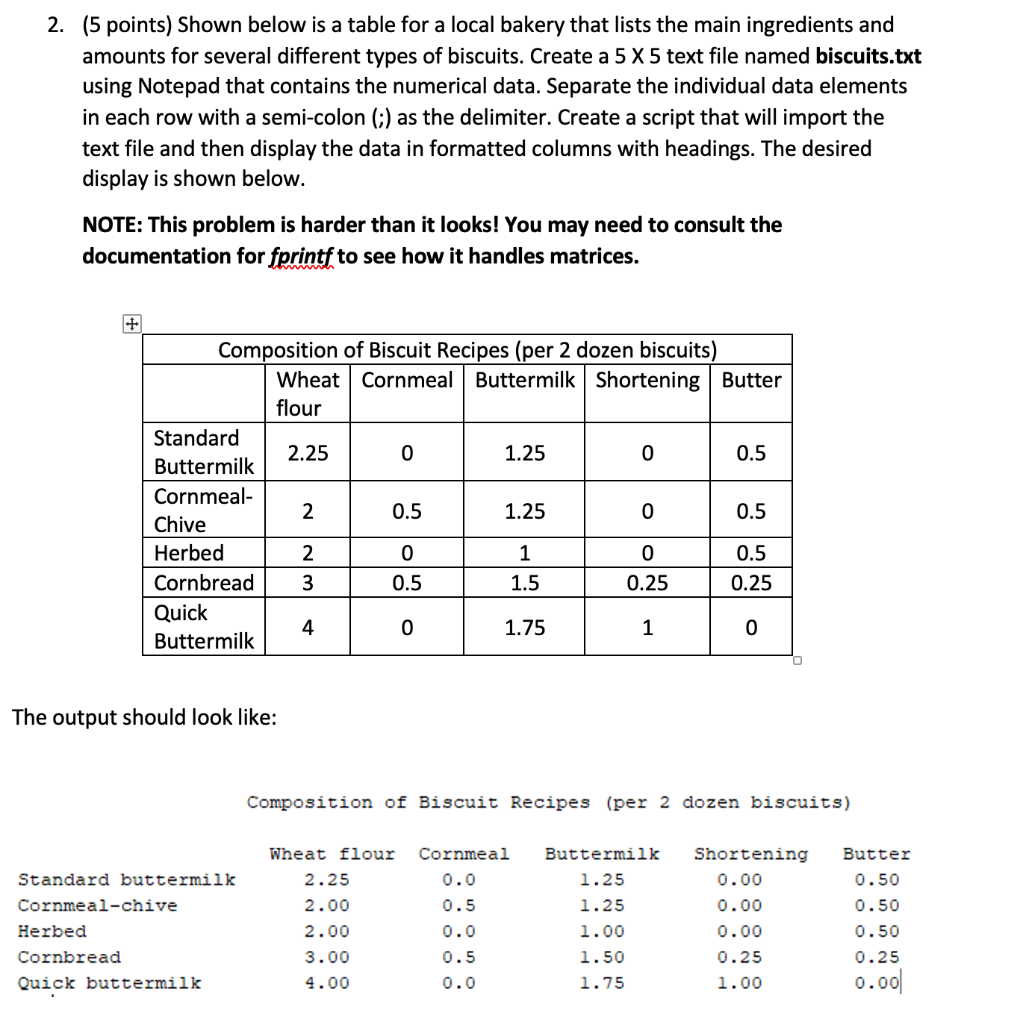
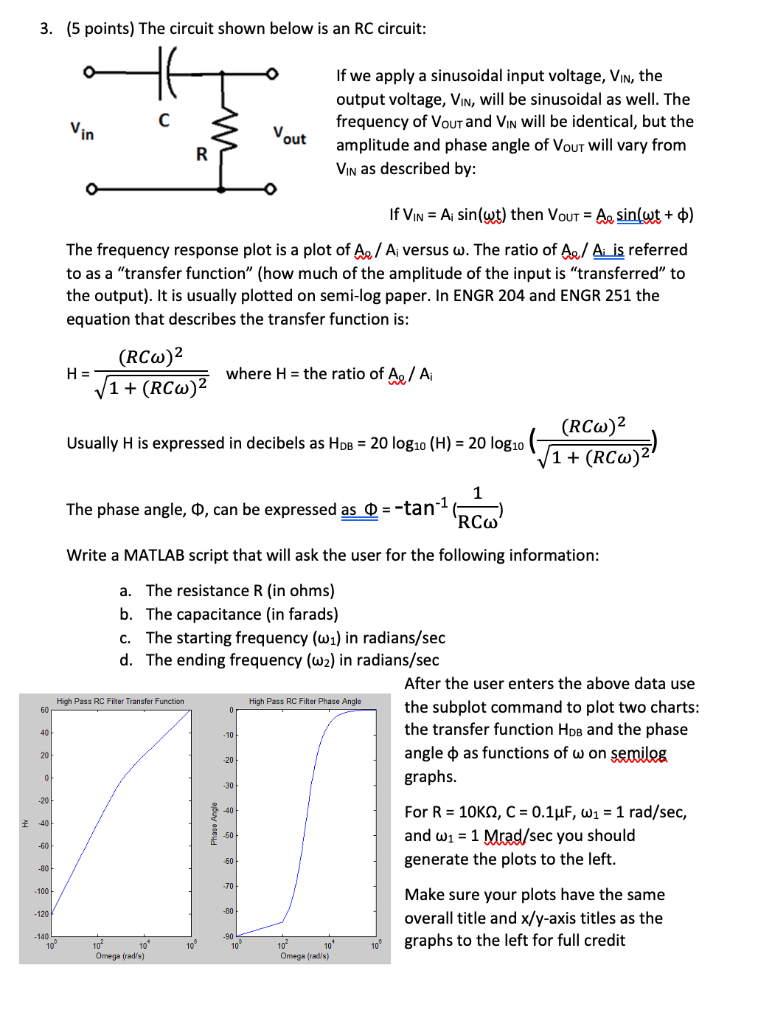
2. (5 points) Shown below is a table for a local bakery that lists the main ingredients and amounts for several different types of biscuits. Create a 5 X 5 text file named biscuits.txt using Notepad that contains the numerical data. Separate the individual data elements in each row with a semi-colon (;) as the delimiter. Create a script that will import the text file and then display the data in formatted columns with headings. The desired display is shown below. NOTE: This problem is harder than it looks! You may need to consult the documentation for fprintf to see how it handles matrices. + Composition of Biscuit Recipes (per 2 dozen biscuits) Wheat Cornmeal Buttermilk Shortening Butter flour Standard 2.25 0 1.25 0 0.5 Buttermilk Cornmeal- 2 0.5 1.25 0 0.5 Chive Herbed 2 0 1 0 0.5 Cornbread 3 0.5 1.5 0.25 0.25 Quick 4 0 1.75 1 0 Buttermilk The output should look like: Composition of Biscuit Recipes (per 2 dozen biscuits) Cornmeal Shortening Wheat flour 2.25 0.0 0.00 2.00 Standard buttermilk Cornmeal-chive Herbed Cornbread Quick buttermilk Buttermilk 1.25 1.25 1.00 1.50 1.75 0.5 0.0 0.5 0.0 2.00 3.00 4.00 Butter 0.50 0.50 0.50 0.25 0.00 0.00 0.25 1.00 0.001 3. (5 points) The circuit shown below is an RC circuit: C Vin Vout If we apply a sinusoidal input voltage, Vin, the output voltage, VIN, will be sinusoidal as well. The frequency of Vous and ViN will be identical, but the amplitude and phase angle of Vout will vary from Vin as described by: R O If Vin = A sin(wt) then Vout = A, sin(wt + ) The frequency response plot is a plot of A / Aj versus w. The ratio of A./ Ai is referred to as a "transfer function" (how much of the amplitude of the input is "transferred to the output). It is usually plotted on semi-log paper. In ENGR 204 and ENGR 251 the equation that describes the transfer function is: (RCA) H = where H = the ratio of Ac/A V1 + (RCW)2 (RCW)2 Usually H is expressed in decibels as Hop = 20 log10 (H) = 20 log10 ( 11+ (RCW)? The phase angle, 0, can be expressed as 0 = -tan-RW Write a MATLAB script that will ask the user for the following information: a. The resistance R in ohms) b. The capacitance in farads) C. The starting frequency (wa) in radians/sec d. The ending frequency (wa) in radians/sec After the user enters the above data use High Pass RC Fiter Transfer Function High Pass RC Filter Phase Angle the subplot command to plot two charts: the transfer function How and the phase angle o as functions of w on semileg graphs. 60 40 -10 20 -20 0 -30 -20 40 -50 For R = 10K12, C = 0.1uF, W1 = 1 rad/sec, and W1 = 1 Mrad/sec you should generate the plots to the left. -60 60 -80 -70 -100 - 120 -80 Make sure your plots have the same overall title and x/y-axis titles as the graphs to the left for full credit -140 10 -90 10 Omega rad/s) 10 Omega (rad) 2. (5 points) Shown below is a table for a local bakery that lists the main ingredients and amounts for several different types of biscuits. Create a 5 X 5 text file named biscuits.txt using Notepad that contains the numerical data. Separate the individual data elements in each row with a semi-colon (;) as the delimiter. Create a script that will import the text file and then display the data in formatted columns with headings. The desired display is shown below. NOTE: This problem is harder than it looks! You may need to consult the documentation for fprintf to see how it handles matrices. + Composition of Biscuit Recipes (per 2 dozen biscuits) Wheat Cornmeal Buttermilk Shortening Butter flour Standard 2.25 0 1.25 0 0.5 Buttermilk Cornmeal- 2 0.5 1.25 0 0.5 Chive Herbed 2 0 1 0 0.5 Cornbread 3 0.5 1.5 0.25 0.25 Quick 4 0 1.75 1 0 Buttermilk The output should look like: Composition of Biscuit Recipes (per 2 dozen biscuits) Cornmeal Shortening Wheat flour 2.25 0.0 0.00 2.00 Standard buttermilk Cornmeal-chive Herbed Cornbread Quick buttermilk Buttermilk 1.25 1.25 1.00 1.50 1.75 0.5 0.0 0.5 0.0 2.00 3.00 4.00 Butter 0.50 0.50 0.50 0.25 0.00 0.00 0.25 1.00 0.001 3. (5 points) The circuit shown below is an RC circuit: C Vin Vout If we apply a sinusoidal input voltage, Vin, the output voltage, VIN, will be sinusoidal as well. The frequency of Vous and ViN will be identical, but the amplitude and phase angle of Vout will vary from Vin as described by: R O If Vin = A sin(wt) then Vout = A, sin(wt + ) The frequency response plot is a plot of A / Aj versus w. The ratio of A./ Ai is referred to as a "transfer function" (how much of the amplitude of the input is "transferred to the output). It is usually plotted on semi-log paper. In ENGR 204 and ENGR 251 the equation that describes the transfer function is: (RCA) H = where H = the ratio of Ac/A V1 + (RCW)2 (RCW)2 Usually H is expressed in decibels as Hop = 20 log10 (H) = 20 log10 ( 11+ (RCW)? The phase angle, 0, can be expressed as 0 = -tan-RW Write a MATLAB script that will ask the user for the following information: a. The resistance R in ohms) b. The capacitance in farads) C. The starting frequency (wa) in radians/sec d. The ending frequency (wa) in radians/sec After the user enters the above data use High Pass RC Fiter Transfer Function High Pass RC Filter Phase Angle the subplot command to plot two charts: the transfer function How and the phase angle o as functions of w on semileg graphs. 60 40 -10 20 -20 0 -30 -20 40 -50 For R = 10K12, C = 0.1uF, W1 = 1 rad/sec, and W1 = 1 Mrad/sec you should generate the plots to the left. -60 60 -80 -70 -100 - 120 -80 Make sure your plots have the same overall title and x/y-axis titles as the graphs to the left for full credit -140 10 -90 10 Omega rad/s) 10 Omega (rad)