

Answered step by step
Verified Expert Solution
Question
1 Approved Answer
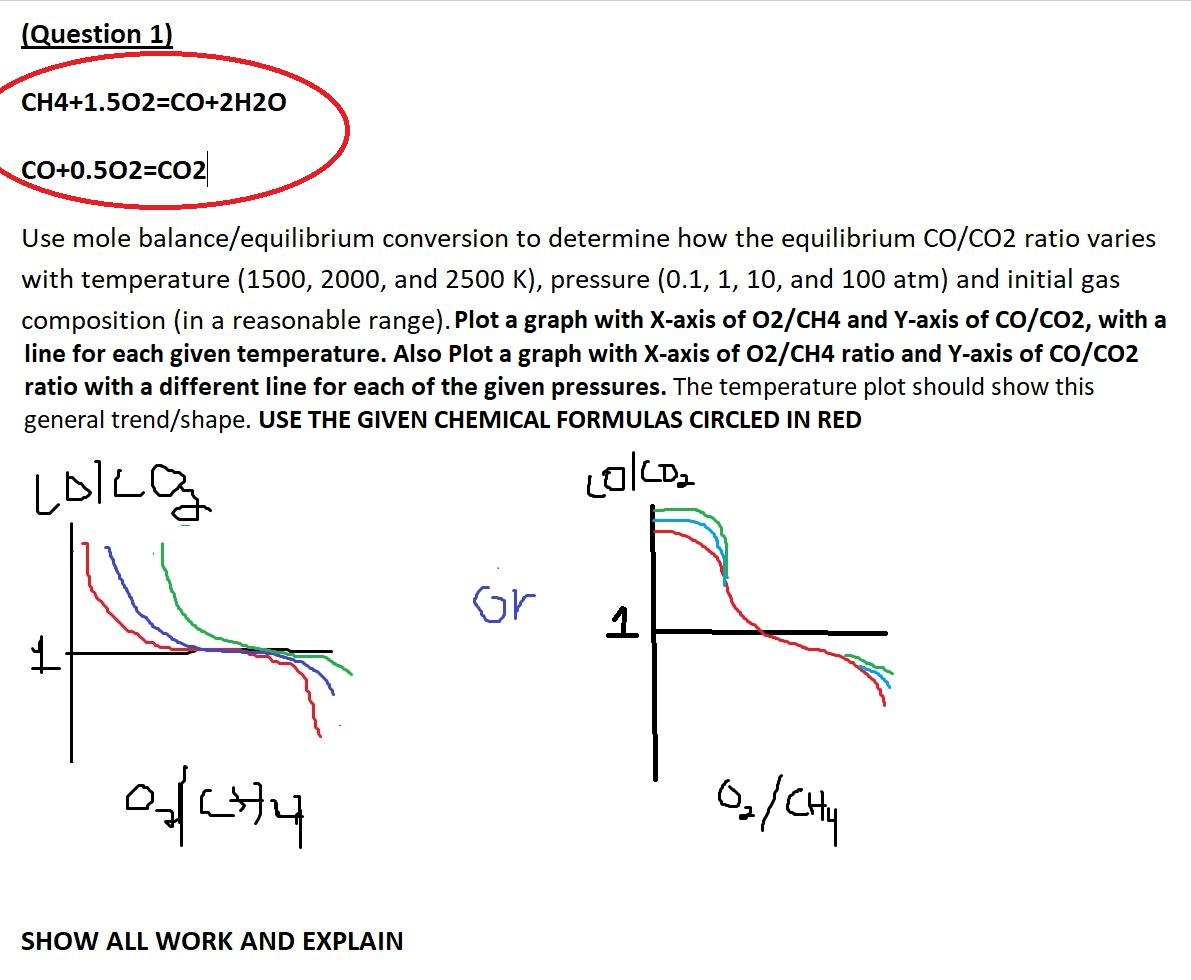
PLOT 2 GRAPHS WITH X-AXIS OF O2/CH4 and Y-AXIS OF CO/CO2 USING THE FOLLOWING INFORMATION. IF YOU DON'T DO THIS THEN I WILL INSTANT THUMBS
PLOT 2 GRAPHS WITH X-AXIS OF O2/CH4 and Y-AXIS OF CO/CO2 USING THE FOLLOWING INFORMATION. IF YOU DON'T DO THIS THEN I WILL INSTANT THUMBS DOWN AND REPORT
Step by Step Solution
There are 3 Steps involved in it
Step: 1

Get Instant Access to Expert-Tailored Solutions
See step-by-step solutions with expert insights and AI powered tools for academic success
Step: 2

Step: 3
Ace Your Homework with AI
Get the answers you need in no time with our AI-driven, step-by-step assistance
Get Started
Introduction To Engineering Heat Transfer
Authors: G. F. Nellis, S. A. Klein
1st Edition
110717953X, 9781107179530