

Question
Plot a graph, similar to the one below, with the new variables (1)/(T) on the x -axis and LnP on the y -axis. Use the
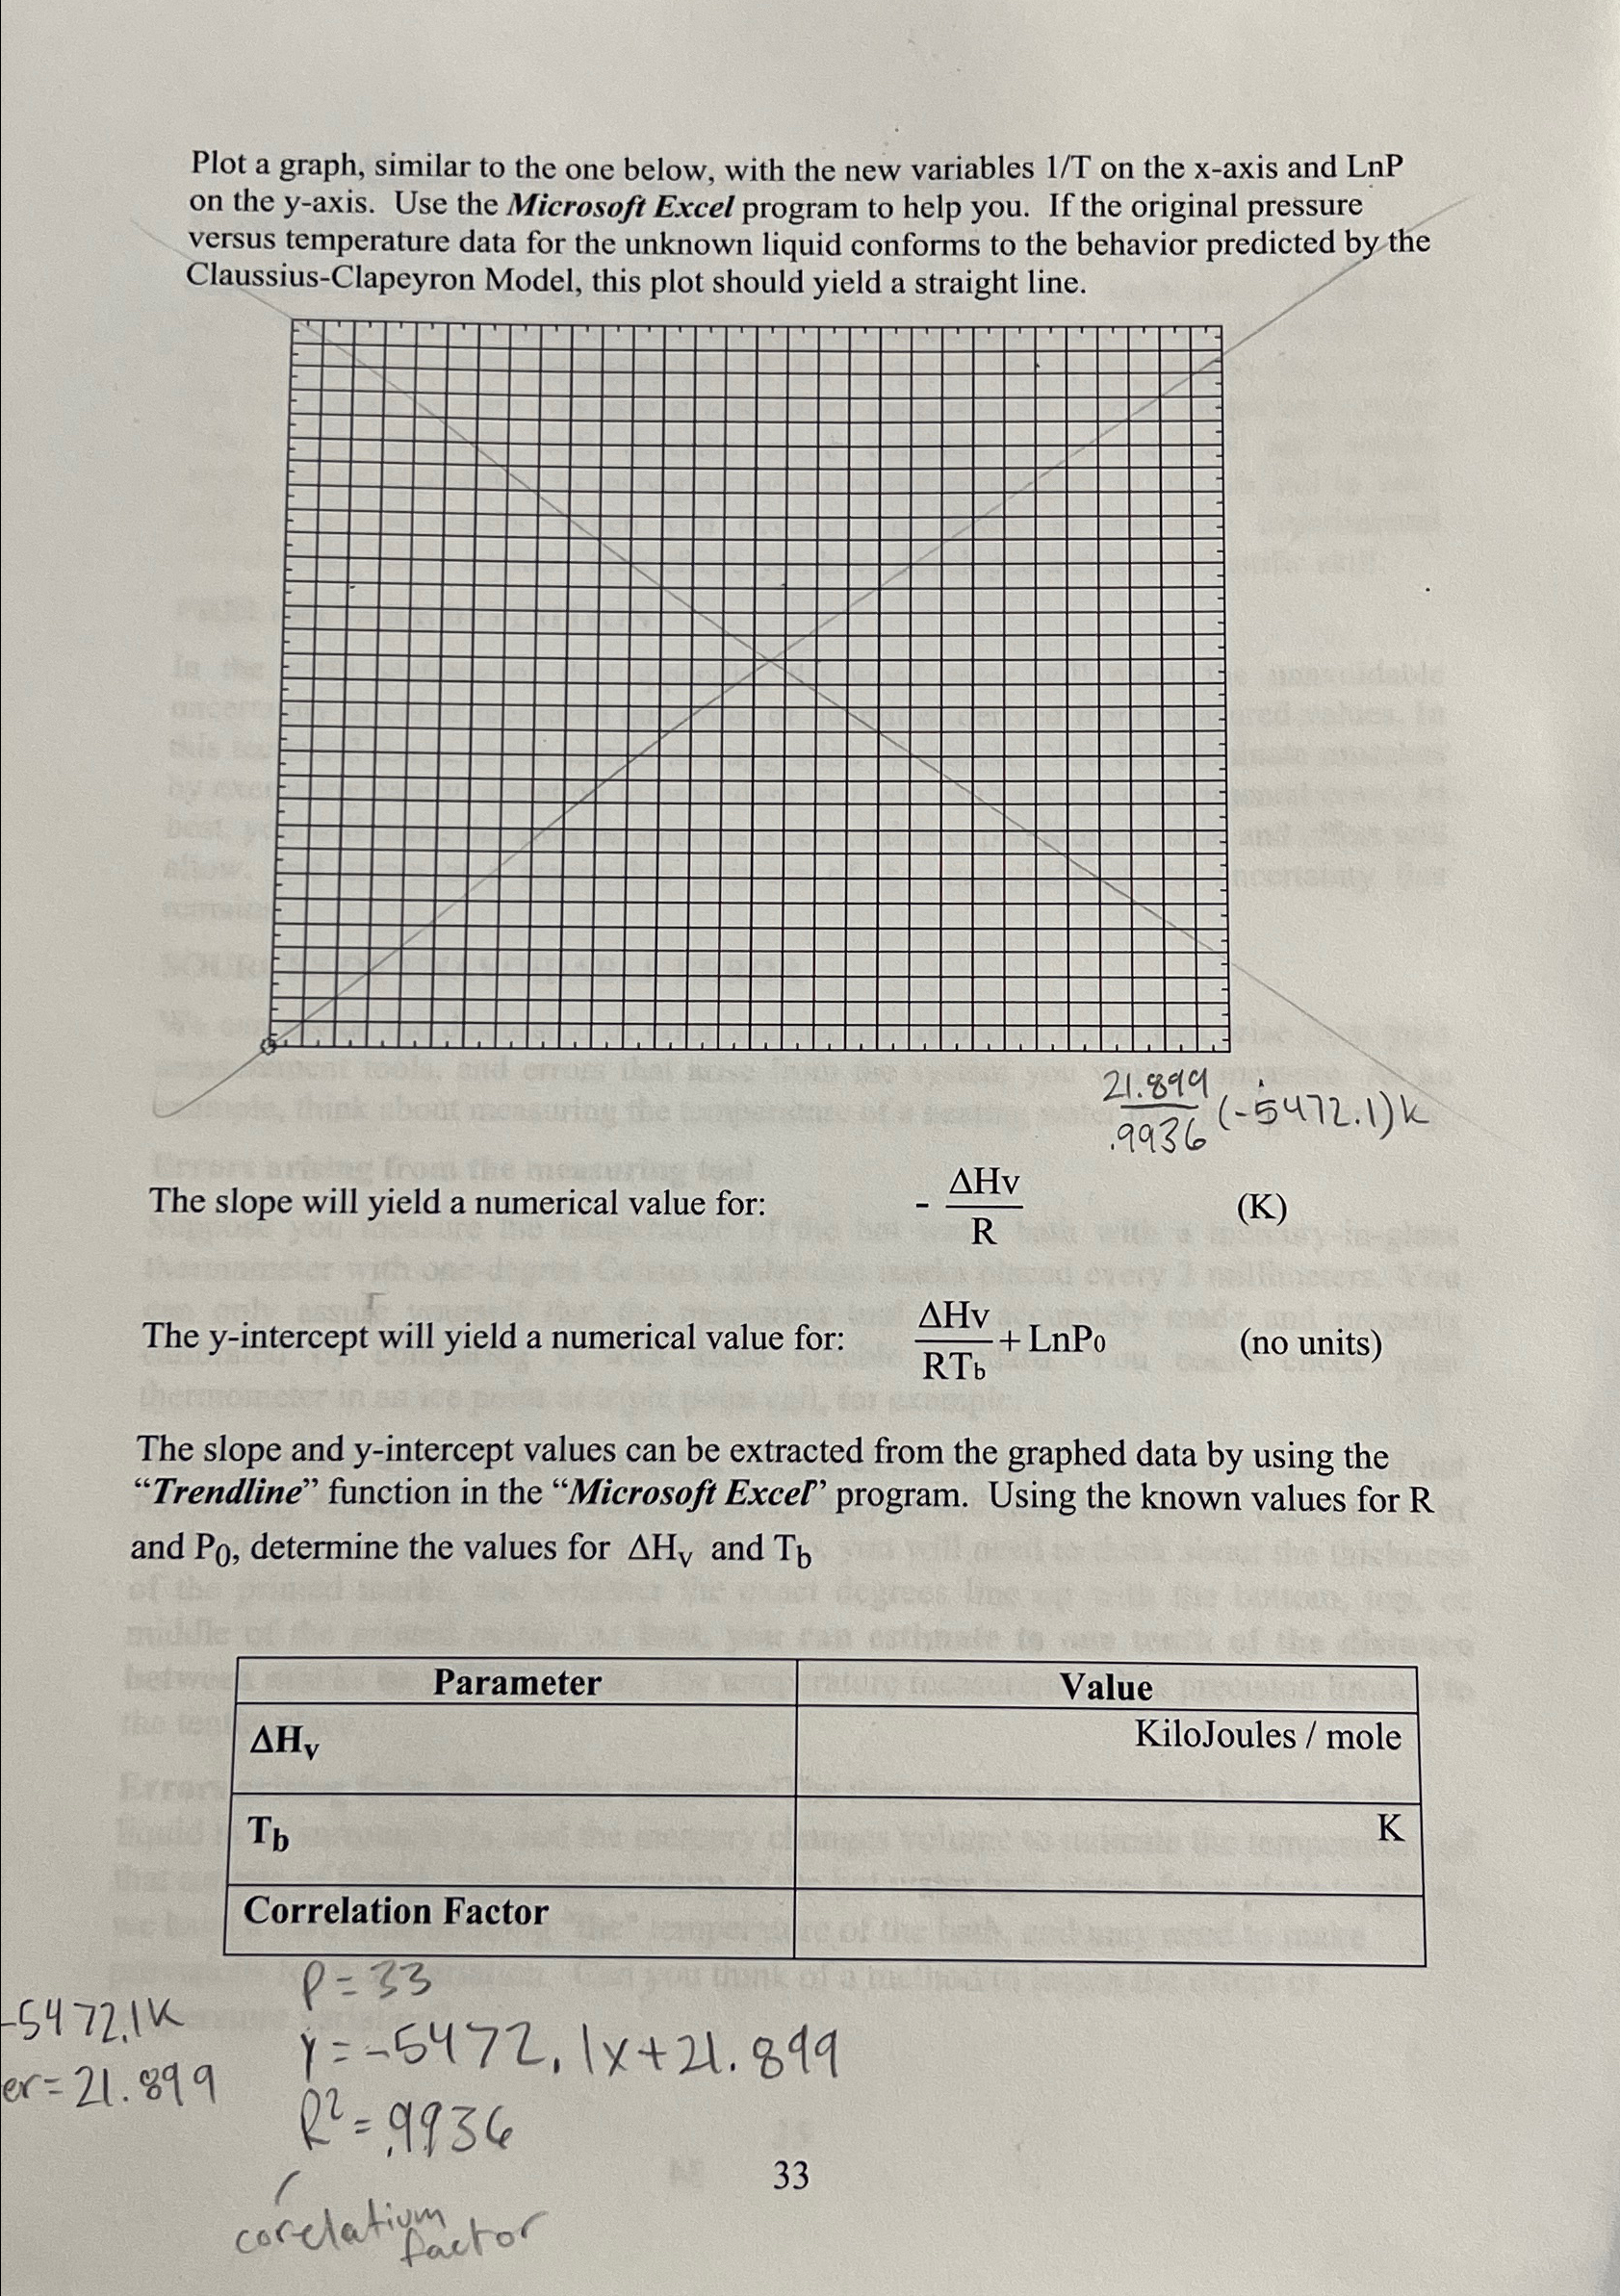
Plot a graph, similar to the one below, with the new variables
(1)/(T) on the
x-axis and
LnP on the
y-axis. Use the Microsoft Excel program to help you. If the original pressure versus temperature data for the unknown liquid conforms to the behavior predicted by the Claussius-Clapeyron Model, this plot should yield a straight line.\
(4.0*1)/(.9936)(-5472.1)k\ The slope will yield a numerical value for:\
-(\\\\Delta Hv)/(R)\ (K)\ The y-intercept will yield a numerical value for:
(\\\\Delta Hv)/(RT_(b))+LnP_(0), (no units)\ The slope and y-intercept values can be extracted from the graphed data by using the "Trendline" function in the "Microsoft Excel" program. Using the known values for R and
P_(0), determine the values for
\\\\Delta H_(V) and
T_(b)\ \\\\table[[Parameter,Value],[
\\\\Delta H_(v),KiloJoules / mole],[
T_(b),],[Correlation Factor,]]\
-5472.1K\
er=21.899\
P=33\ y=-5472,1x+21.899\ R^(2)=.9936\ 33
Plot a graph, similar to the one below, with the new variables
(1)/(T)on the
x-axis and
LnPon the
y-axis. Use the Microsoft Excel program to help you. If the original pressure versus temperature data for the unknown liquid conforms to the behavior predicted by the Claussius-Clapeyron Model, this plot should yield a straight line.\
(4.0*1)/(.9936)(-5472.1)k\ The slope will yield a numerical value for:\
-(\\\\Delta Hv)/(R)\ (K)\ The y-intercept will yield a numerical value for:
(\\\\Delta Hv)/(RT_(b))+LnP_(0),(no units)\ The slope and y-intercept values can be extracted from the graphed data by using the "Trendline" function in the "Microsoft Excel" program. Using the known values for R and
P_(0), determine the values for
\\\\Delta H_(V)and
T_(b)\ \\\\table[[Parameter,Value],[
\\\\Delta H_(v),KiloJoules / mole],[
T_(b),],[Correlation Factor,]]\
-5472.1K\
er=21.899\
P=33\ y=-5472,1x+21.899\ R^(2)=.9936\ 33
Step by Step Solution
There are 3 Steps involved in it
Step: 1

Get Instant Access to Expert-Tailored Solutions
See step-by-step solutions with expert insights and AI powered tools for academic success
Step: 2

Step: 3
Ace Your Homework with AI
Get the answers you need in no time with our AI-driven, step-by-step assistance
Get Started
Innovative Subsurface Remediation Field Testing Of Physical Chemical And Characterization Technologies
Authors: Mark L. Brusseau, David A. Sabatini, John S. Gierke, Michael D. Annable
1st Edition
0841235961, 978-0841235960