

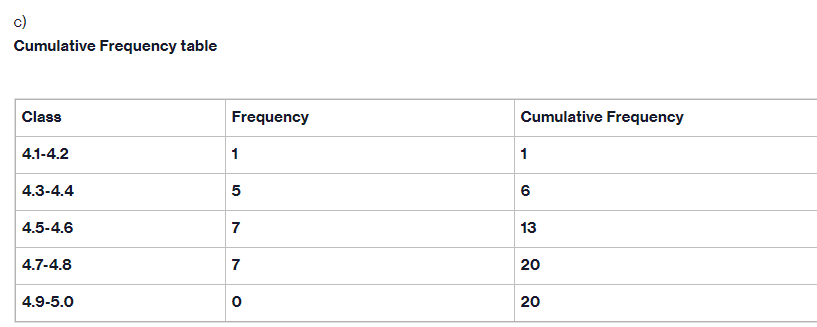
Question
Plot a suitable cumulative frequency graph. ( in the x-axis put upper class boundary) (e) Use your cumulative frequency graph to determine if the data
Plot a suitable cumulative frequency graph.
( in the x-axis put upper class boundary)
(e) Use your cumulative frequency graph to determine if the data is normally distributed or not? and give me the reason
Step by Step Solution
There are 3 Steps involved in it
Step: 1

Get Instant Access to Expert-Tailored Solutions
See step-by-step solutions with expert insights and AI powered tools for academic success
Step: 2

Step: 3
Ace Your Homework with AI
Get the answers you need in no time with our AI-driven, step-by-step assistance
Get Started
Real Analysis On Intervals
Authors: A D R Choudary, Constantin P Niculescu
1st Edition
8132221486, 9788132221487