

Answered step by step
Verified Expert Solution
Question
1 Approved Answer
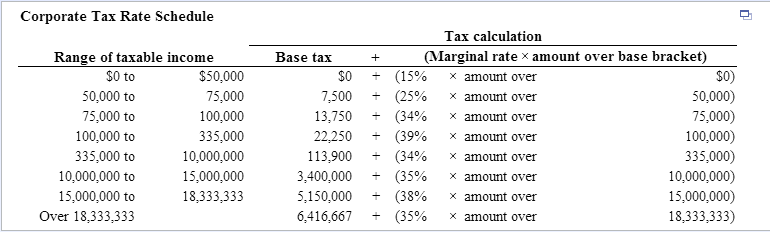
Plot the marginal tx rates (measured on the y axis) againist the pretax income levels (measured on the x axis) explain the relationship between these
Plot the marginal tx rates (measured on the y axis) againist the pretax income levels (measured on the x axis) explain the relationship between these variables.
Step by Step Solution
There are 3 Steps involved in it
Step: 1

Get Instant Access to Expert-Tailored Solutions
See step-by-step solutions with expert insights and AI powered tools for academic success
Step: 2

Step: 3
Ace Your Homework with AI
Get the answers you need in no time with our AI-driven, step-by-step assistance
Get Started
Finance For Freelancers Financial Intelligence
Authors: Andrew Holmes
1st Edition
1408101165, 978-1408101162