Answered step by step
Verified Expert Solution
Question
1 Approved Answer
plot the output shipping cost at the four locations, and then connect the dots to generate the output shipping-cost curve. Then, plot the total

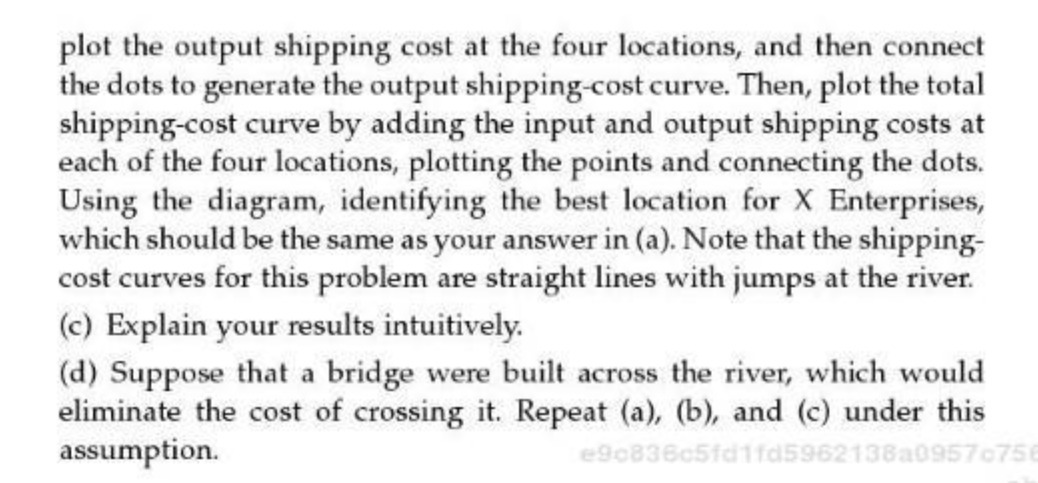
plot the output shipping cost at the four locations, and then connect the dots to generate the output shipping-cost curve. Then, plot the total shipping-cost curve by adding the input and output shipping costs at each of the four locations, plotting the points and connecting the dots. Using the diagram, identifying the best location for X Enterprises, which should be the same as your answer in (a). Note that the shipping- cost curves for this problem are straight lines with jumps at the river. (c) Explain your results intuitively. (d) Suppose that a bridge were built across the river, which would eliminate the cost of crossing it. Repeat (a), (b), and (c) under this assumption. e9c836c5fd1fd5962138a09570756
Step by Step Solution
There are 3 Steps involved in it
Step: 1

Get Instant Access to Expert-Tailored Solutions
See step-by-step solutions with expert insights and AI powered tools for academic success
Step: 2

Step: 3

Ace Your Homework with AI
Get the answers you need in no time with our AI-driven, step-by-step assistance
Get Started


