

Answered step by step
Verified Expert Solution
Question
1 Approved Answer
Pls answer all the question a, b and c with solution. Not into jumping to answer tq. Below are extracted data from the income statement
Pls answer all the question a, b and c with solution. Not into jumping to answer tq.
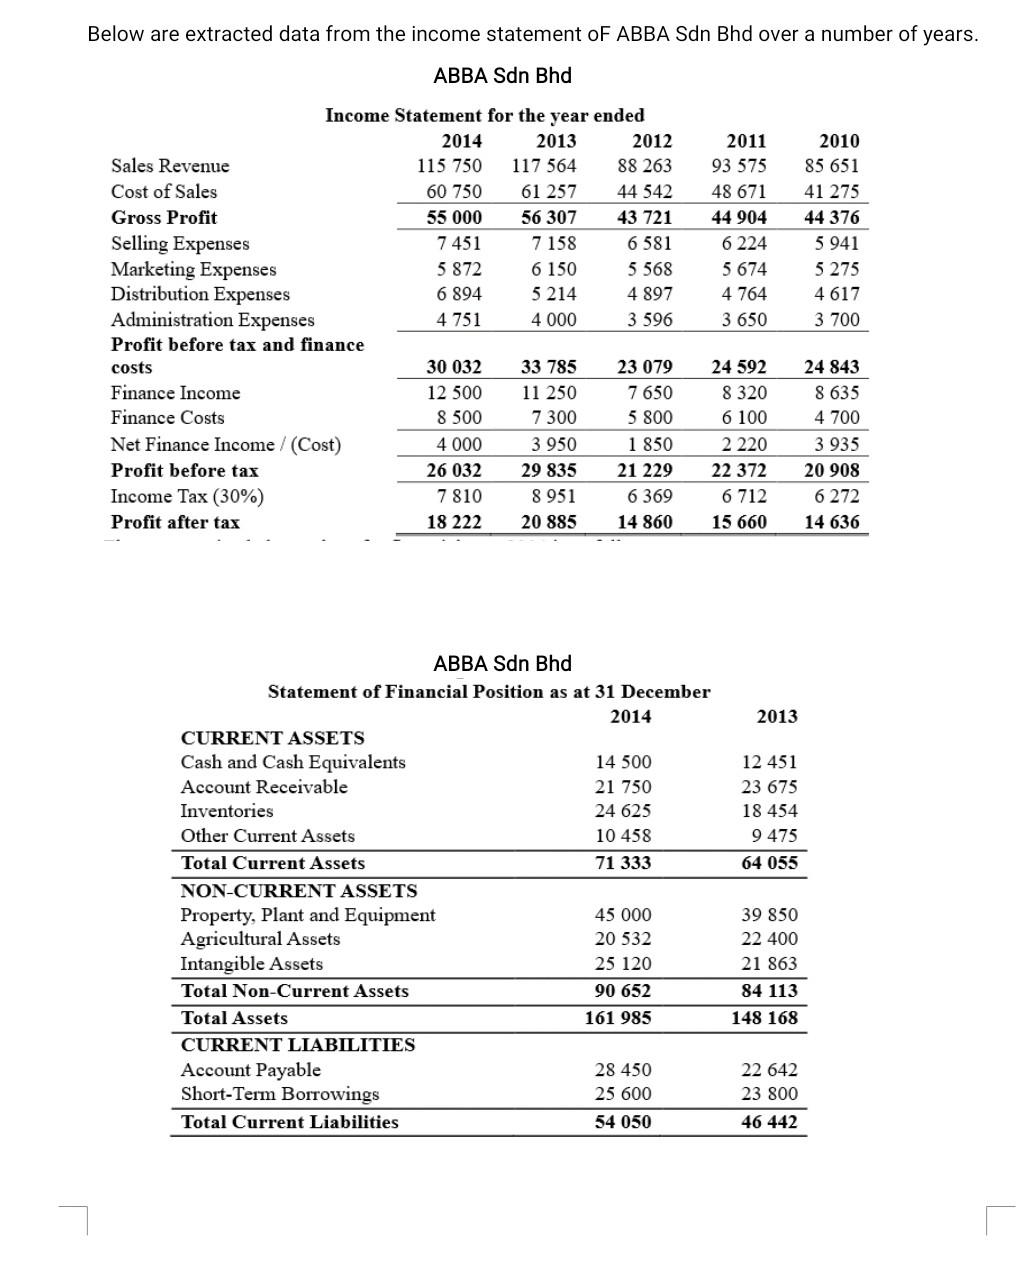
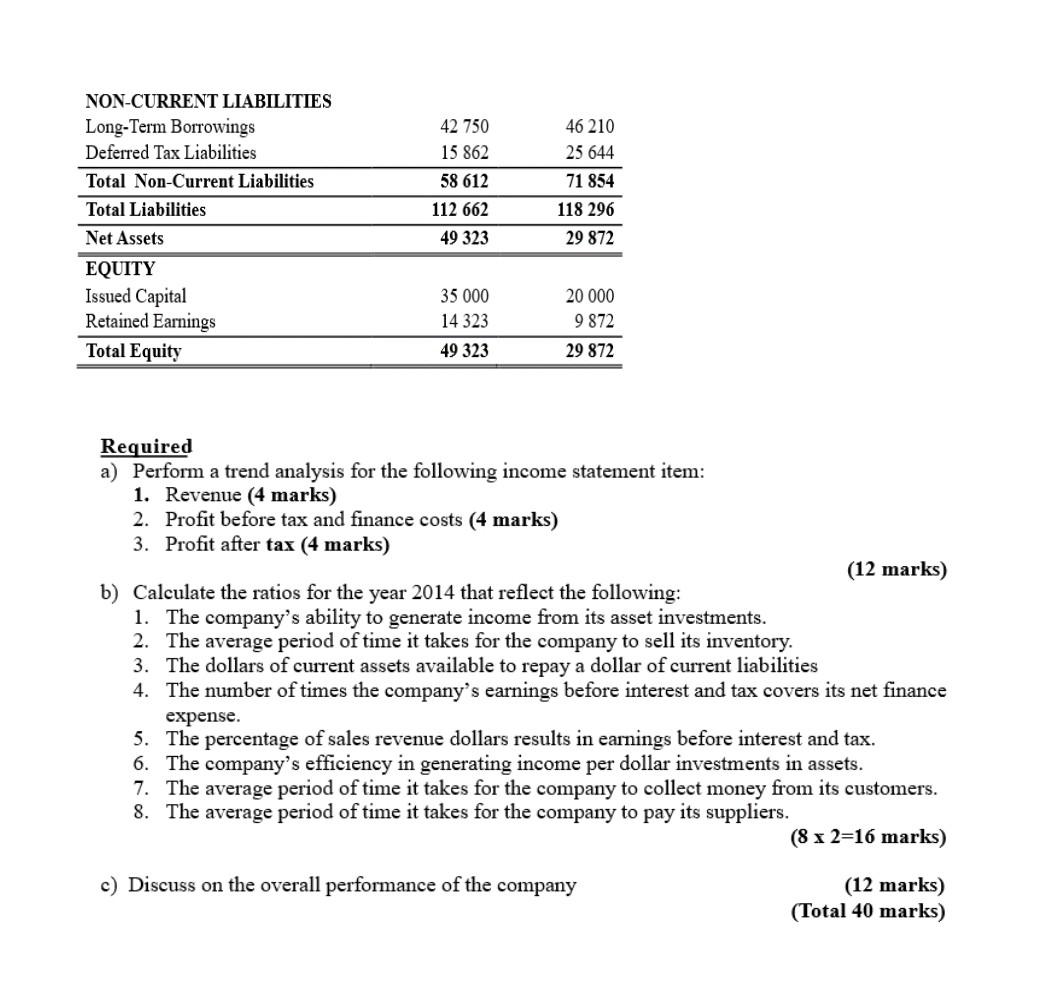
Below are extracted data from the income statement of ABBA Sdn Bhd over a number of years. ABBA Sdn Bhd 2011 2010 93 575 85 651 48 671 41 275 44 904 44 376 5 941 Income Statement for the year ended 2014 2013 2012 Sales Revenue 115 750 117 564 88 263 Cost of Sales 60 750 61 257 44 542 Gross Profit 55 000 56 307 43 721 Selling Expenses 7451 7 158 6 581 Marketing Expenses 5 872 6 150 5 568 Distribution Expenses 6 894 5 214 4 897 Administration Expenses 4 751 4 000 3 596 Profit before tax and finance costs 30 032 33 785 23 079 Finance Income 12 500 11 250 7 650 Finance Costs 8 500 7 300 5 800 6 224 5 674 5 275 4 764 4617 3 650 3 700 24 592 24 843 8 635 8 320 6 100 4 700 4 000 3 950 1 850 2 220 3 935 26 032 29 835 21 229 22 372 20 908 Net Finance Income / (Cost) Profit before tax Income Tax (30%) Profit after tax 7810 8 951 6 369 6 712 6272 18 222 20 885 14 860 15 660 14 636 ABBA Sdn Bhd Statement of Financial Position as at 31 December 2014 2013 14 500 12 451 CURRENT ASSETS Cash and Cash Equivalents Account Receivable Inventories 21 750 23 675 18 454 24 625 10 458 Other Current Assets 9475 Total Current Assets 71 333 64 055 NON-CURRENT ASSETS 45 000 39 850 Property, Plant and Equipment Agricultural Assets Intangible Assets 20 532 22 400 25 120 21 863 Total Non-Current Assets 90 652 84 113 Total Assets 161 985 148 168 CURRENT LIABILITIES 28 450 22 642 Account Payable Short-Term Borrowings 25 600 23 800 Total Current Liabilities 54 050 46 442 NON-CURRENT LIABILITIES 42 750 46 210 Long-Term Borrowings Deferred Tax Liabilities 15 862 25 644 Total Non-Current Liabilities 58 612 71 854 Total Liabilities 112 662 118 296 Net Assets 49 323 29 872 35 000 20 000 EQUITY Issued Capital Retained Earnings Total Equity 14 323 9 872 49 323 29 872 Required a) Perform a trend analysis for the following income statement item: 1. Revenue (4 marks) 2. Profit before tax and finance costs (4 marks) 3. Profit after tax (4 marks) (12 marks) b) Calculate the ratios for the year 2014 that reflect the following: 1. The company's ability to generate income from its asset investments. 2. The average period of time it takes for the company to sell its inventory. 3. The dollars of current assets available to repay a dollar of current liabilities 4. The number of times the company's earnings before interest and tax covers its net finance expense. 5. The percentage of sales revenue dollars results in earnings before interest and tax. 6. The company's efficiency in generating income per dollar investments in assets. 7. The average period of time it takes for the company to collect money from its customers. 8. The average period of time it takes for the company to pay its suppliers. (8 x 2=16 marks) c) Discuss on the overall performance of the company (12 marks) (Total 40 marks)Step by Step Solution
There are 3 Steps involved in it
Step: 1

Get Instant Access to Expert-Tailored Solutions
See step-by-step solutions with expert insights and AI powered tools for academic success
Step: 2

Step: 3
Ace Your Homework with AI
Get the answers you need in no time with our AI-driven, step-by-step assistance
Get Started
Asset Pricing
Authors: John Cochrane
1st Edition
0691121370,1400829135