

Answered step by step
Verified Expert Solution
Question
1 Approved Answer
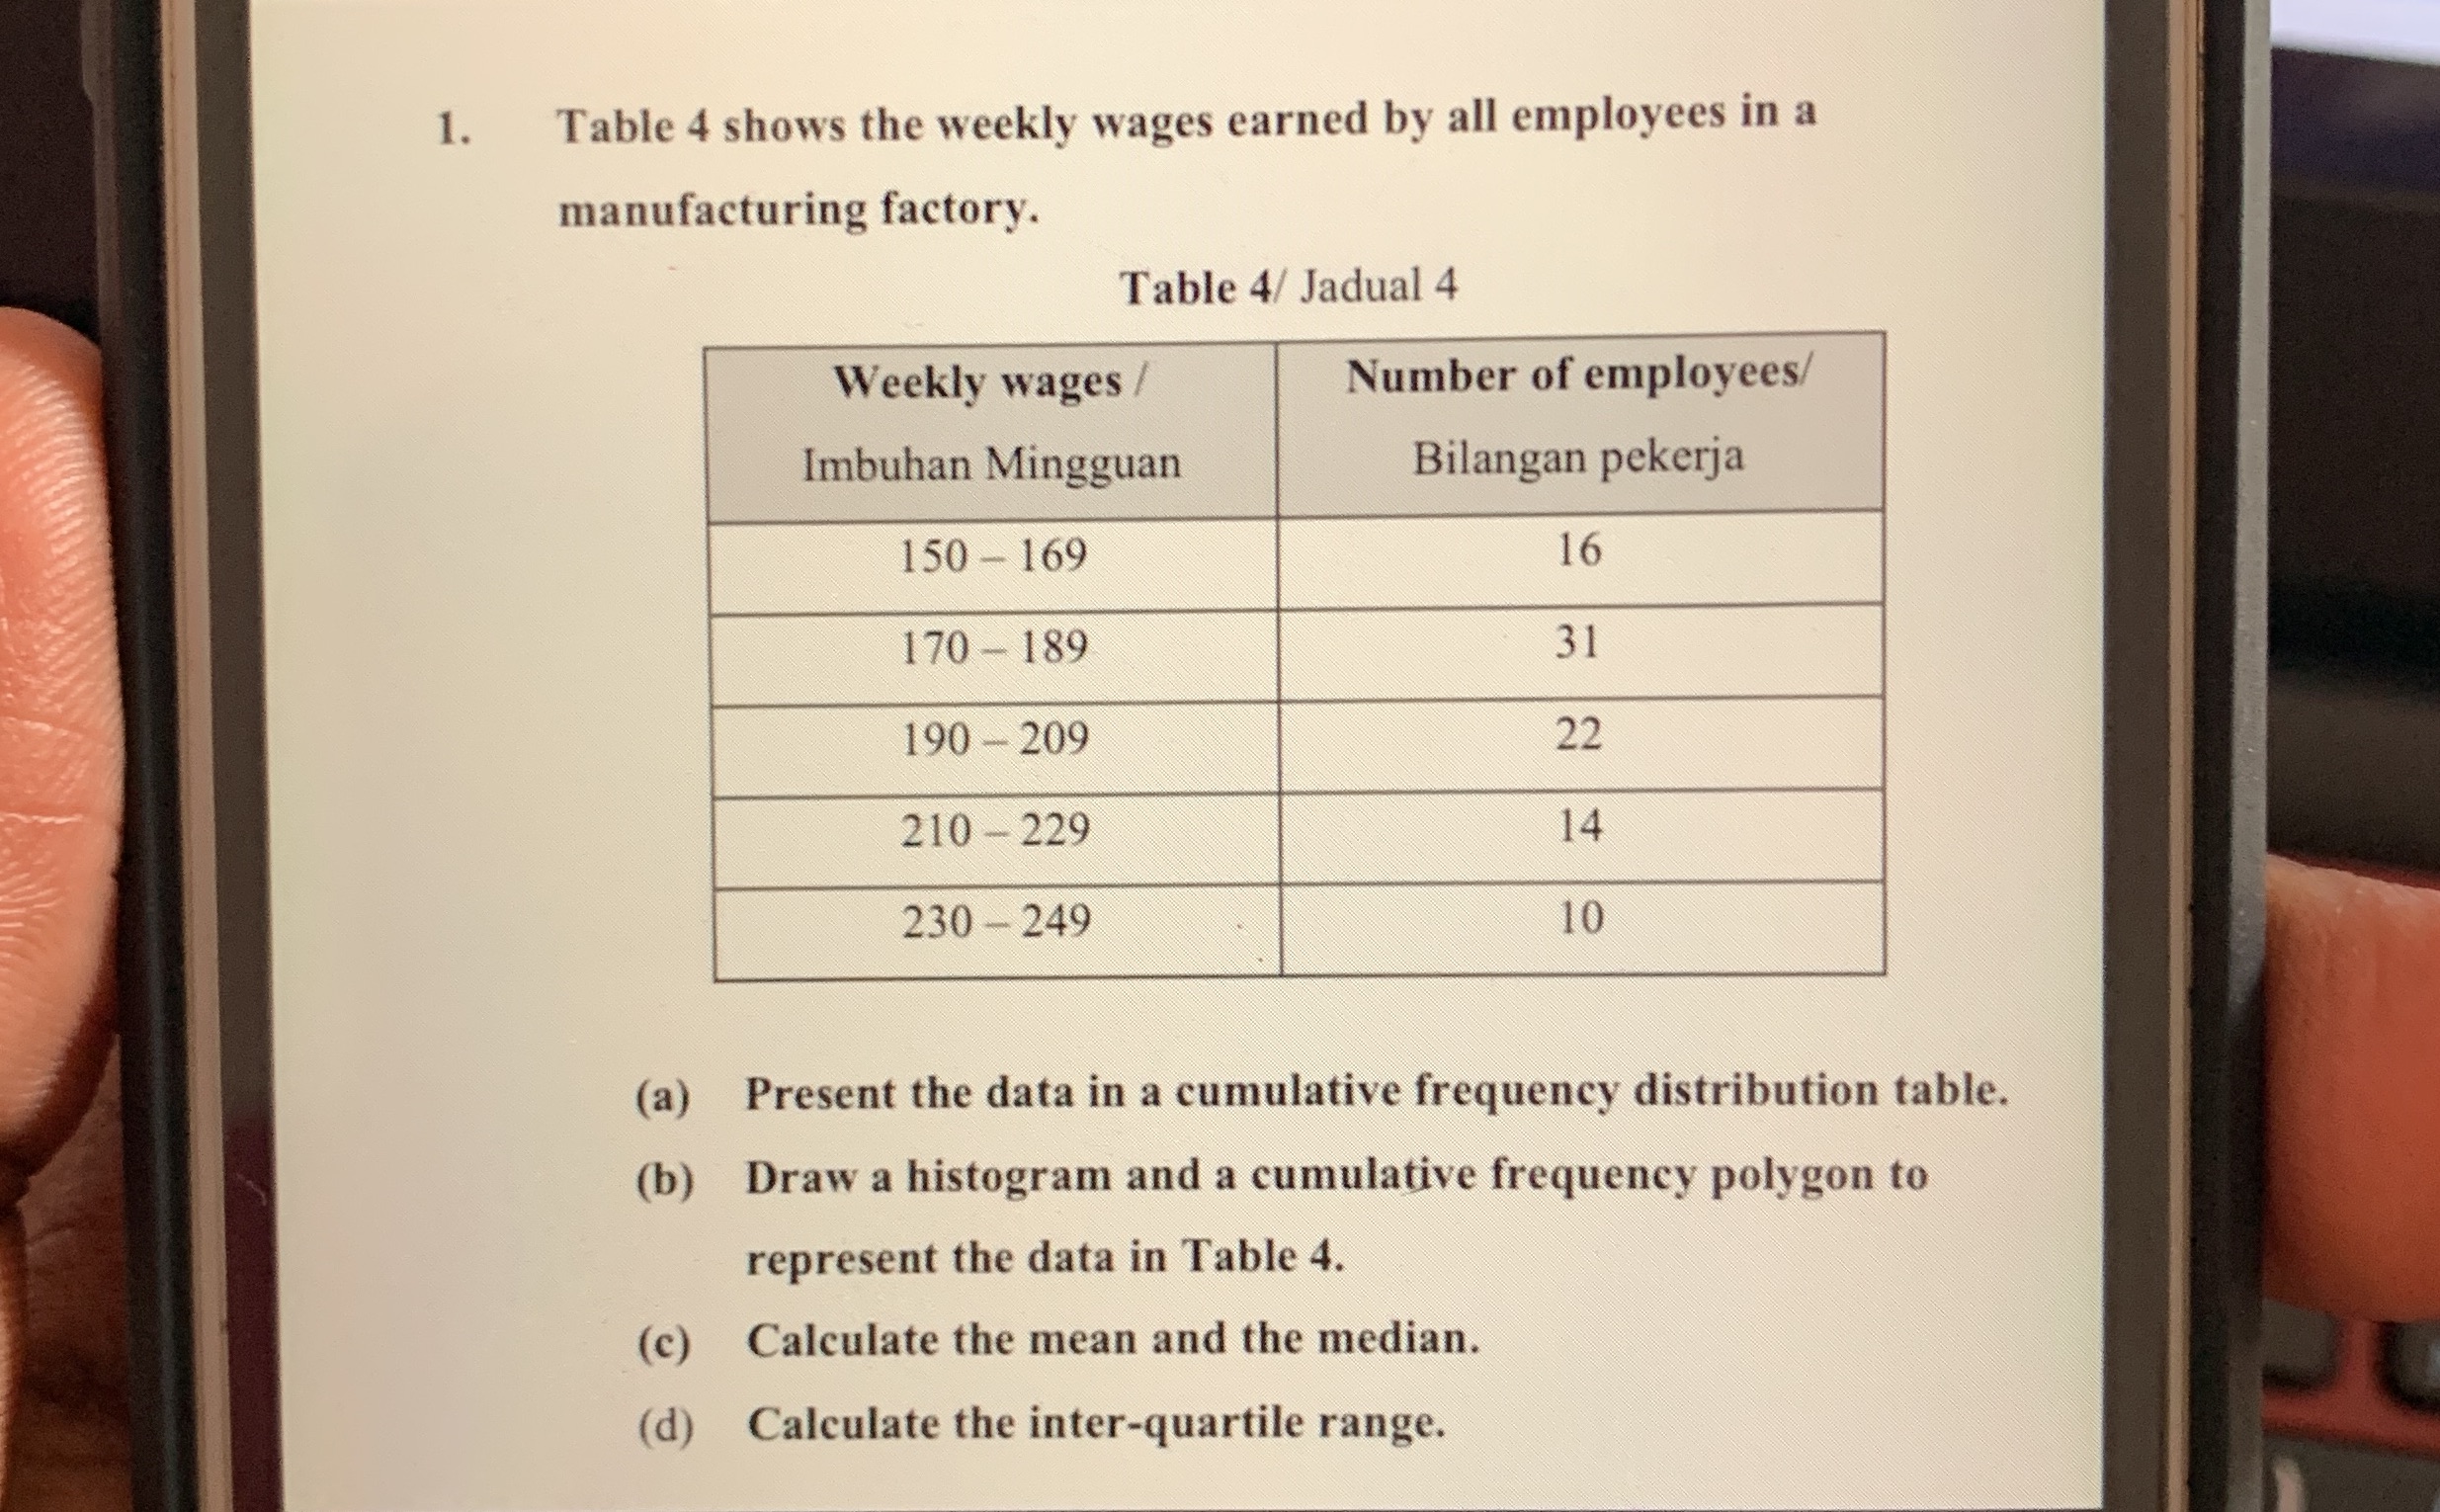
Pls answer for these questions 1 a,b,c,dTq 1. Table 4 shows the weekly wages earned by all employees in a manufacturing factory. Table 4/ Jadual
Pls answer for these questions 1 a,b,c,dTq
Step by Step Solution
There are 3 Steps involved in it
Step: 1

Get Instant Access to Expert-Tailored Solutions
See step-by-step solutions with expert insights and AI powered tools for academic success
Step: 2

Step: 3
Ace Your Homework with AI
Get the answers you need in no time with our AI-driven, step-by-step assistance
Get Started
Business Analytics Data Analysis and Decision Making
Authors: S. Christian Albright, Wayne L. Winston
5th edition
1133629601, 9781285965529 , 978-1133629603