PLS ANSWER

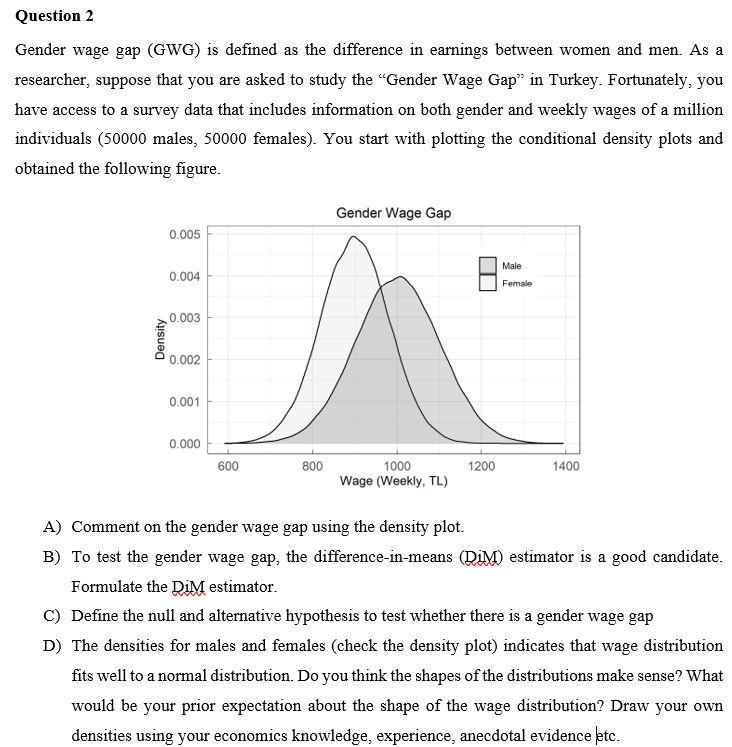
Gender wage gap (GWG) is defined as the difference in earnings between women and men. As a researcher, suppose that you are asked to study the "Gender Wage Gap" in Turkey. Fortunately, you have access to a survey data that includes information on both gender and weekly wages of a million individuals ( 50000 males, 50000 females). You start with plotting the conditional density plots and obtained the following figure. A) Comment on the gender wage gap using the density plot. B) To test the gender wage gap, the difference-in-means (DiM) estimator is a good candidate. Formulate the DiM estimator. C) Define the null and alternative hypothesis to test whether there is a gender wage gap D) The densities for males and females (check the density plot) indicates that wage distribution fits well to a normal distribution. Do you think the shapes of the distributions make sense? What would be your prior expectation about the shape of the wage distribution? Draw your own densities using your economics knowledge, experience, anecdotal evidence etc. Gender wage gap (GWG) is defined as the difference in earnings between women and men. As a researcher, suppose that you are asked to study the "Gender Wage Gap" in Turkey. Fortunately, you have access to a survey data that includes information on both gender and weekly wages of a million individuals ( 50000 males, 50000 females). You start with plotting the conditional density plots and obtained the following figure. A) Comment on the gender wage gap using the density plot. B) To test the gender wage gap, the difference-in-means (DiM) estimator is a good candidate. Formulate the DiM estimator. C) Define the null and alternative hypothesis to test whether there is a gender wage gap D) The densities for males and females (check the density plot) indicates that wage distribution fits well to a normal distribution. Do you think the shapes of the distributions make sense? What would be your prior expectation about the shape of the wage distribution? Draw your own densities using your economics knowledge, experience, anecdotal evidence etc


