pls help me
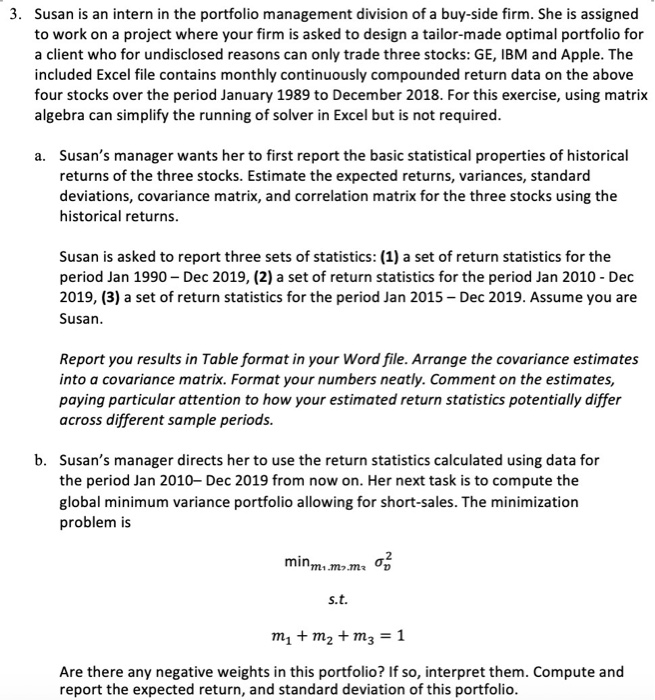
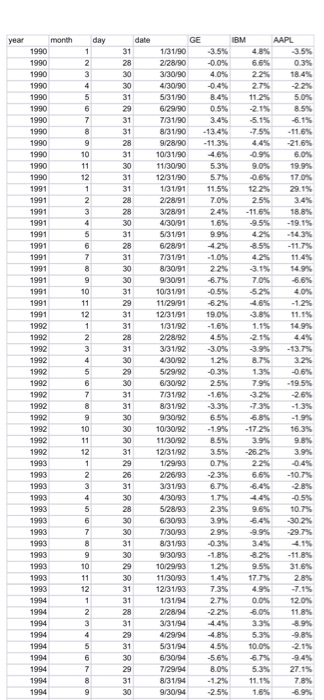
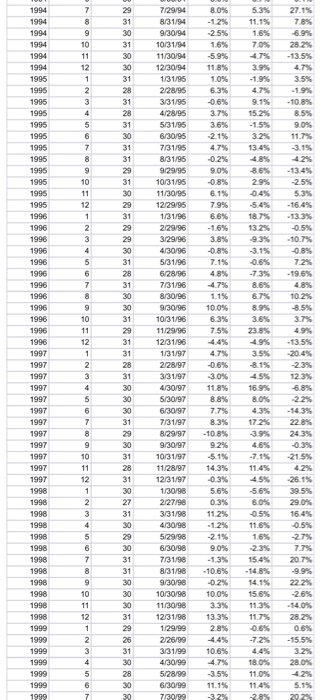
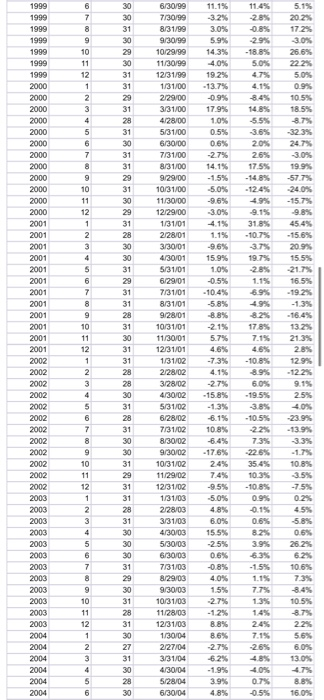
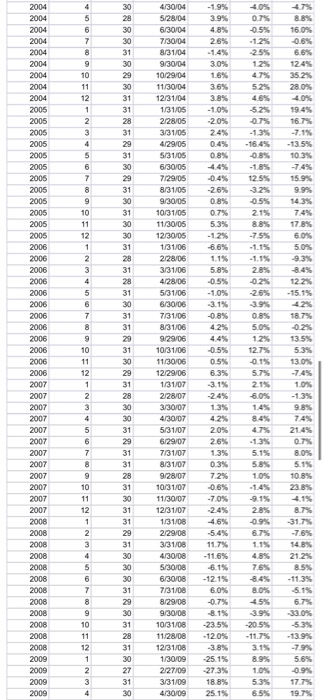
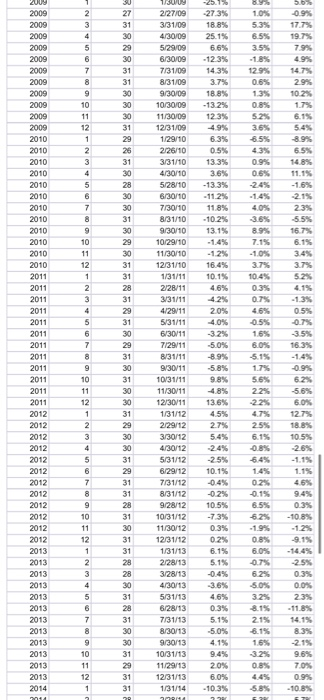
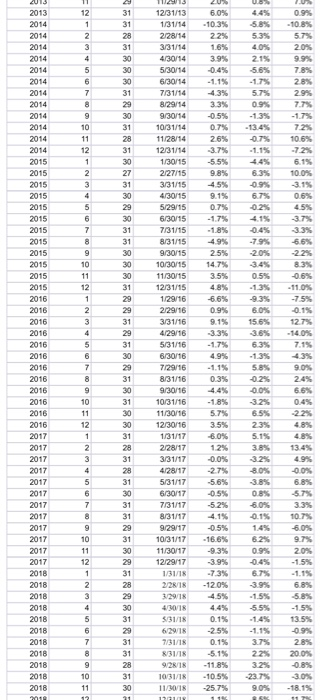
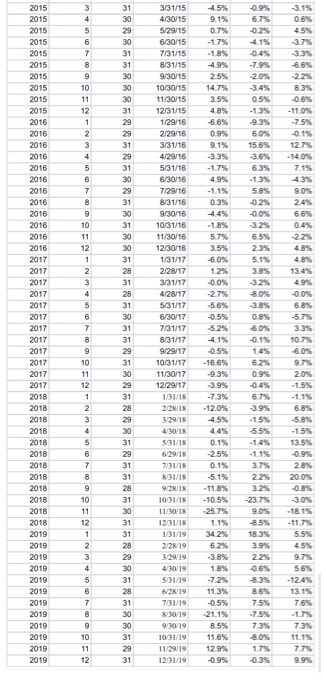
3. Susan is an intern in the portfolio management division of a buy-side firm. She is assigned to work on a project where your firm is asked to design a tailor-made optimal portfolio for a client who for undisclosed reasons can only trade three stocks: GE, IBM and Apple. The included Excel file contains monthly continuously compounded return data on the above four stocks over the period January 1989 to December 2018. For this exercise, using matrix algebra can simplify the running of solver in Excel but is not required. a. Susan's manager wants her to first report the basic statistical properties of historical returns of the three stocks. Estimate the expected returns, variances, standard deviations, covariance matrix, and correlation matrix for the three stocks using the historical returns. Susan is asked to report three sets of statistics: (1) a set of return statistics for the period Jan 1990 - Dec 2019, (2) a set of return statistics for the period Jan 2010 - Dec 2019, (3) a set of return statistics for the period Jan 2015 - Dec 2019. Assume you are Susan. Report you results in Table format in your Word file. Arrange the covariance estimates into a covariance matrix. Format your numbers neatly. Comment on the estimates, paying particular attention to how your estimated return statistics potentially differ across different sample periods. b. Susan's manager directs her to use the return statistics calculated using data for the period Jan 2010-Dec 2019 from now on. Her next task is to compute the global minimum variance portfolio allowing for short-sales. The minimization problem is minm..mama on s.t. my + m2 + m3 = 1 Are there any negative weights in this portfolio? If so, interpret them. Compute and report the expected return, and standard deviation of this portfolio. day date month 1990 1990 1990 1990 1990 40% 1900 1990 1990 1990 1990 40% 1980 1991 1991 1991 99 1991 1991 1991 1991 1991 1992 1992 1992 1992 OOO 88 NDENDE & BOON 1992 GEBM AAPL 1/31/90 35% 48 2/28/90 -0.0% 66% 0. 3/30/90 229 18.4% 4/30/90 -0.4% 21 -22 5/31/90 1125 5.0% 6/29/90 0.5% -215 8.5% 7/31/90 A 8/31/90 13.4% 75% 11.8% 92890 - 113 21.6% 10/31/90 11/30/90 53% 904 199X 1231190 17.0% 1/31191 11.5% 228191 70% 2.5% 32891 245 11% 18.8% 16% 19.15 5/31/91 6/28/91 42% - 11.7% 7/31/91 -10% 11.4% 8/30/91 22% 9/30/91 70% 1031191 -0.5% 524 11/29/91 6.2% 46% 12/31/91 19 ON -3.8% 11.15 1/31/92 -16% 1.15 149 2/28/92 45% 2.15 44% 3/31/92 -30% - 13.7% 4/30/92 12% 3.2% 5/29/92 -0.3% 13 6/30/92 25% 7945 - 19.5% 7/31/92 -16% -32% -26% 8/31/92 33% -739 -1.3% 9/30/92 10/30/92 - 172 16.3% 11/30/92 12/31/92 3.5% 3.9% 1/29/93 7% 225/93 -23% 3/3193 4/30/93 17% 5/28193 23% 6/30/93 7/30193 2.9% 831/93 0.3% 930793 102993 11/30793 177% 28% 12131/93 7.3% 1/31/94 27% 12.0 2/28/94 -22% 60% 11.8% 3/31/93 445 335 4/29/94 48% 53% 5/31/93 4.5% 100% 2.15 6/30/94 -5.6% 67% 94% 7/29/94 8.0% 5.3% 27.1% 8/31/94 -1.2% 11.1% 7.8% 9/30/94 2.5% 16% 1992 1992 1992 65% 1992 88889988 1992 1992 1990 1993 1990 1995 1993 1993 1993 1993 1993 1993 1993 1993 1994 1994 1994 1994 1994 1904 0992891 KAKAK 9 12% 149 1994 1994 1994 58 1994 1994 80% -1.2 -25% 53% 11.15 27.1% 7.8% -6.9% 1994 1994 o 16% 70% 4.7% 1994 1994 1995 1995 7/29794 8/31/94 9/30/94 10/31/94 11/30/94 12/30/94 1/31/95 2/28/95 3/31/96 4/28/96 5/31/96 6/30/95 713195 8/31/96 5.9% 11.8% 10% 6.3% 06 -1995 -13.5% 47 3.5% -1.9% -10.8% 8.5% 1995 1995 GO ON 91% 15.25 -15% 1995 3.6% 1995 1995 47 134 1995 1996 1996 1996 88988989489 -0.89 29 6.15 5.3% 1995 79% 1996 18.7% -13.3% 1996 NONNE & 38% 1996 1996 934 -10.7% -0.8% 96 -19 7.15 4.8% 4.79 115 100% 6.3% 75% 06% -7 86% 6.7% 1996 1996 894 1996 1996 10.2 8.5% 3.7% 4.9% -13.5% -20.4% 1996 1996 4.7% 1997 1997 3.6% 23.8% 499 3.5% 8.15 4.5% 16.99 809 4.3% 172 1997 1997 -30% 1.8% 8.8% 77% 1997 1997 1997 1997 -10.8% 10/31/05 11/30195 12129795 1/31/96 229/96 3/2006 4/30/96 531796 6/28/96 7/31/96 8/30796 9/30/96 10/31/96 11/29/96 12/31/96 1/31/97 2/28/97 3/31/97 4/30/97 5/30/97 6/30/97 73197 8/29/97 9/30/97 10/31/97 1128797 123197 130/98 227198 33198 4/30/98 5129198 6/30/98 7/31/98 8/31/08 9/30/98 10/30/98 11.30198 12/31/98 129/99 2/26/99 3/31/99 4/30/99 5/28/99 6/30/99 7/30/99 ON 1997 1997 1997 64666466666666666 11.49 45% NOUNDB8SOON -5.1% 14.3% -0.3% 5.6% 0.3% 1124 1997 1998 1990 1998 1990 22 OS 888 1998 1998 1998 1908 15.45 -1489 1415 456% 2223 113 21% 90% 13% -10.6% -0.2% 10.09 3.3% 133% 28% 44% 10.6% 4.7% -3.5% 11.15 -3.2% 1998 1998 1998 1999 1999 1999 11.7% 0.5% 7245 44% 18.0% 11.09 15.5% 3.2% 28.0% 1909 1999 5.1% 2023 1999 11.4% 1999 1999 88 -20% -0.8% 5.1% 2023 17.2% 1999 1999 26.6% 1999 1999 1999 2000 88% 5.0% 47% 41 8.45 5.0 2000 11.1% 32 30% 5.9% 14.3% 40% 19.2% -13.7% -0.9% 1795 1.0% 0.55 0.6% -27% 14.15 -15% 50% 10.5% 18.5% 2000 2000 2000 6/30/99 7830/99 8/31/99 930/99 10/29/99 11/30/99 12/31/99 131100 22900 3/31/00 4/28/00 5/31/00 6/30/00 713100 8/31/00 9129/00 10/31/00 11/30/00 12129/00 1/31/01 22801 3/30/01 4/30/01 5/31/01 6/29/01 5.5% 36% 20% 2000 O NON SOGN 2000 2000 2000 2000 2001 24.75 19.9% -57.7% 24.0% -15,75 5 & 5 && - 1245 49% 0.1% 31.8% -107 2001 2001 -30% 41 1.15 -9.6% 15.9% 10% -0.5% 2001 2001 19.7% 24 1.1% 69% - 15.6% 20.9% 15.5% 21.79 16.5% 2001 2001 2001 8245 17 8% 2001 2001 2001 2001 2002 2002 -5.8% 8.8% -21% 5.7% 46% -73% 16.4% 13.2% 21.3% 28% 12.9% -12,2% 2002 2002 2002 2002 YON -10.8% 8.9% 60% -195 -3.8% -10.5% -27% -15 85 -13% 6.15 10.8% 25% 4.0% 2002 73% 2002 2002 22 2002 2002 2002 2003 2008 2003 3.5% -7.5% 8/31/01 9/2001 10/31/01 11/30/01 12/31/01 1/31/02 2/28/02 3/28/02 4/30/02 5/31/02 6/28102 7/3102 8/30/02 9/30/02 10/31/02 11/29 02 1213102 101/03 2128/03 3/31/03 4/30/03 5/30/03 630/03 7/31/03 8/29/03 9/30/03 1031/03 11/28103 12/31/03 1/30/04 2/27/04 3/31/04 4/30/04 5/28104 6/30/04 17.6% 24% 745 95% -5.0% 4.8% 10.8% 09 0.1% 00% 3.8% 2003 15.5% 2003 2003 2003 2003 2008 2003 380VUN 106 77 1.35 2003 2003 06% -0.89 4.0% 1.5% 27% -1.2% 8.8% 8.6% -27% 24 -1.9% 3.9% 48% 2004 8.7% 223 5.6% 6095 130% 4.7% 7.15 -26% 4.8% 4.0% 07 0.5% 2004 2004 2004 2004 2004 16.0% 2004 2004 88 -1.9% 3.9% 4.8% 40% 0.7% 0.5% - 1256 2004 16.0% 0.6% 2004 26% 2004 2004 2004 4/30/04 5/2004 6/30/04 730/04 8/31/04 9/30/04 10/29/04 11/30/04 1231104 1/31/05 22805 -1.4% 3.0% 888 16% 12% 47 5.2% 45% 124% 3523 28.0% 2004 2004 36% 3.8% -10% 2005 2005 2005 07 19.4% 16.7% 24% -13.5% 10:35 0.8% 44% 04 -15% 12.5% 15.9% 2005 2005 2005 2005 2005 2005 2005 2005 2005 N&D NON- 88988 8988989 0.5% 2.15 0.7% 5.3% 17.8% 1246 66% 75% -1.15 2006 5.0% LIS 28% 2006 2006 2006 2006 5.8% -0.5% -10% 1223 2006 423 18.7% 2006 0.85 50% 2006 2006 2006 2006 2006 OOOON OWN-NO 42% 44% -0.5% 05% 6.35 -3.1% 12% 1279 0.15 5.7% 2.15 609 13.5% 5.3% 13.0% 2007 2007 -1.3% 2007 13% 2007 429105 5/31/05 6/30/05 7129/05 8/31/05 30/05 10/31/05 11/30/05 12/30/05 131/06 2128/06 3/31/06 4/28/06 531/06 6/30/06 7/31/06 8/31/06 9/29/06 10/31/06 11/30/06 12/29/06 1/31/07 22807 3/30/ 07 4/30/07 5/31/07 6/29/07 7/31/107 8/31/07 9/28107 10/31/07 11/30/07 1231/07 1/31/08 2129/08 3131/08 4/30/08 5/30/08 630/08 7/31/08 8/29/08 930/08 10/31/08 11/28/08 12/31/08 1/30/09 2/27/09 3/31/09 4/30/09 20% 8.49 47 -13% 21.45 0.75 2007 2007 2007 2007 2007 2007 26% 13% 0.3% 72% 5 10.8% 23.8% 4.15 2007 -7.0% 2007 2008 0.9% 2008 -5.45 2008 N NON- 588 - 116% 2008 2008 4. 21.25 76% 2008 84 - 11.3% 5.15 2008 2008 2008 2008 33.0% -12-15 6.09 -0.7% 8.15 23.5% -120% -3.8% -25.15 -273% 18 25.1% 45% 39 -20.5% - 11.75 3.1% 2008 2008 2009 -13.9% 799 5.6% 0.9% 177 2009 10% 2009 2009 53% 6.5% 19.7% & 2009 2009 273% 18.8% 25.15 1.045 53 & 2009 2009 65% 35% & 2009 2009 2009 NEW UN- -123% 14.3% -0.9% 17.7% 19.7% 7.9% 49% 14 2.9% 102 17% 6.15 5.4% 1294 05% 13 3.7% 188 2009 2009 2009 2009 2010 1234 4.9% 6.35 OS 133 52 3.6% 65% 43% 09 06% 2010 9%88898988 2010 14.85 2010 2010 215 2010 2010 va -13.3% - 11.2% 11.8% -102 13.15 40% 2010 23% 5.5% 16.7% 2010 2010 1 2010 2010 16.45 10.15 37 2011 2011 2011 2011 2011 ON 0.5% 0.7% -3.5% 16.3 8.94 71% -10% 37 10.45 0.3% 07 46% 0.5% 1.6% 6.0% -5.15 1.75 5.6 2011 2/27/09 3/31/09 4/30/09 5299 630/09 7/31/09 8/31/09 9/30/09 10/30/09 11/30/09 12/31/09 129/10 2/26/10 3/31/10 430 5128/10 6/30/10 7/30/10 831/10 9/30/10 10/29/10 11/30/10 12/31/10 1/31/11 2/28/11 3/31/11 4/29/11 5/31/11 6/30/11 7/29/11 8/31/11 9/30/11 10/31/11 11/30/11 12/30/11 1/31/12 2/29/12 3/30/12 4/30/12 5/31/12 6/29/12 731/12 83112 9/28/12 10/31/12 11/30/12 12/31/12 131/13 2128/13 3/28/13 4/30/13 5/31/13 6/28/13 7/31/13 8/30/13 9/30/13 10/31/13 11/29/13 12131/13 1/31/14 2011 42% 20% -4.0% -32% -50% -8.9% -5.8% 98% 4.8% 13.6% 455 275 2011 0.9% 2011 2011 2011 2011 -5.6% 6.0% 2012 5.45 61% 2012 2012 2012 2012 2012 2012 66 898 14 1.1% 2012 2012 65% 2012 10 2012 & SOUND ON -25% 10.15 0.4% -02 10.5% -73% 0.3% 0.2% 6.15 5.15 -0.4 -3.6% 5855 2013 6.09 144 25% 2013 2013 2013 62 5.0% 3.25 0.0% 2013 2013 2013 0.3% 5.1% -50% 4.1% 215 6.15 16% 8.3% 2013 2013 2013 2013 2013 0.89 20% 6.0% -10.3% 95% 70% 0.9% 10.8% 2014 -5.8% Una 2013 4.4% 60% 10 2014 10.8% 2014 5858 229 ST 2014 20% GOWN - 1.6% 39% 2014 2014 78% 2014 -1.1% 20% 536 404 2.15 55% . 57 9 -13 30% 07 43% 2.9% 2014 2014 2014 2014 -0.5 0.7% 265 2014 10.6% 2014 2015 NNE 44 63% 2015 888498989898988 98% 100% 3.15 2015 2015 2015 2015 2015 02 4.19 9.15 0.75 -1.75 -18% 4.9% 25% 3.3% 2015 2015 2015 2015 2015 0.5% -1 93% 2016 2016 60% 11 -7.5% 0.1% 12.7% -14.0% 2016 2016 15 EN -3.6% 6.3% 2016 12/31/13 1/31/14 2/28/14 3/31/14 4/30/14 5/30/14 6/30/14 7/31/14 8/20/14 9/30/14 10/3114 1128/14 12/31/14 1/30/15 227115 33415 4/30/15 5.2015 6/30/15 731/15 8/31/15 9/30/15 1030 11/30/15 12131/15 129/16 2/29/16 3/31/16 4/29/16 5/31/16 6130/16 7/29/16 8/31/16 93016 10/31/16 11/30/16 12/30/16 1/31/17 228/17 3/31/17 428/17 531/17 6/30/17 7/31/17 8/31/17 9/29/17 103/17 11/30/17 12/29/17 1/31/18 2/28/18 3/29/18 4/30/18 $3118 6/29/18 7/01/18 31/18 9/28/18 10/31/18 11/30/18 2016 2016 9.0% 24% 2016 N8 NOVO OOON 3.5% 48% 66% 0.9% 9.1% -33% -1.7% 49% - 1.1% 0.3% 4.4% -1895 5.7% 3.5% -6.0% 12% -0.04 -27% -5.65 0.5% -5.2% 58 -0.25 0% 325 2016 2016 2016 2016 2017 2017 2017 2017 2017 0.4% 23% 5.15 2017 6.0% 2017 2017 2017 65595 10 2017 05 - 16.6% -93% -3.9% 2017 2017 2018 2018 6.8% 2018 85X855 2018 -1.15 2018 2018 2018 2018 - 120% 4.5% 44% 0.15 -25% 0.1% -5.1% -11.8% -10.5% - 2575 -1.5% 13.5% -0,9% 2.8% 20.0% 2018 2018 88 2.2% 325 -23.7% 2018 - 18.1% 2015 2015 2015 2015 0.9% 6.79 024 4.15 0.4% 0.6% 45% 07 17% 2015 2015 3. 6.6% 30 2015 2015 2015 2015 0.5% - 13% 93% 2010 2016 2016 0.6% - 11.0% -7.5% 0.1% 127% & 15.6% & 2016 2016 2016 && 2016 -1 50 025 2016 24% 6.6% 2016 % 2016 -22 2016 2016 2017 4889 6.5% 23% 5.15 13.45 2017 2017 2017 2017 00 2017 Nova 00 ONS WOON OOONOBYONO 2017 2017 2017 2017 3/31/15 4.5% 4/30/15 9.1% 5/29/15 6/30/15 7/31/15 -1.8% 8/31/15 9/30/15 25% 10/30/45 147% 11/30/15 3.5% 12/31/15 48% 1/29/16 86% 2/29/16 3/31/16 4/29/16 5/31/16 -17% 30/16 494 7/29/16 -1.15 8/ 31/16 0.3% 9305 445 1031/16 -18 11/30/16 5.7% 12/30/16 35% 1017 60% 2/28/17 12% 3/31/17 4/28/17 -27% 5/31/17 -5.6% 6/30/17 -0.5% 7/31/17 -5.2% 8/31/17 4.1% 9/29/17 -0.5% 10/31/17 -166% 1130/17 -9.35 12/29/17 3.9% 1/31/18 -73% 2/28/18 -120% 329 45% 40 44% 53/ 0.1% 6918 -255 73 3 -5.15 925 18 11.8% S 105 ILIOS 123/ 1.1% 34245 2219 62% 329 4/30/19 18% 531719 -725 62519 11.3% 7/31/19 -0.5% 8/30/19 21.1% 930/198 .5% 10/119 118 11/29/19 12.9% 12/31/19 -0.9% 32% A 3 0.8% -6.0% 015 145 5.7% 3.3% 10 60% 9.7% 20% -1.5% 2017 0.99 2017 2018 2018 2018 2018 2018 6.7% 3.9% -15% 55 5.85 -1.5% 13.5 0.9% 2018 20.0% 2018 2018 2018 2018 -30% 181% 2018 2018 2019 13119 2019 2019 2019 225 0.6% 8.3% 2019 -124 1315 75% -1.7 2019 2019 2019 2019 2019 2019 2019 75% 75% 73% 80% 17 0.3% 31 99% 3. Susan is an intern in the portfolio management division of a buy-side firm. She is assigned to work on a project where your firm is asked to design a tailor-made optimal portfolio for a client who for undisclosed reasons can only trade three stocks: GE, IBM and Apple. The included Excel file contains monthly continuously compounded return data on the above four stocks over the period January 1989 to December 2018. For this exercise, using matrix algebra can simplify the running of solver in Excel but is not required. a. Susan's manager wants her to first report the basic statistical properties of historical returns of the three stocks. Estimate the expected returns, variances, standard deviations, covariance matrix, and correlation matrix for the three stocks using the historical returns. Susan is asked to report three sets of statistics: (1) a set of return statistics for the period Jan 1990 - Dec 2019, (2) a set of return statistics for the period Jan 2010 - Dec 2019, (3) a set of return statistics for the period Jan 2015 - Dec 2019. Assume you are Susan. Report you results in Table format in your Word file. Arrange the covariance estimates into a covariance matrix. Format your numbers neatly. Comment on the estimates, paying particular attention to how your estimated return statistics potentially differ across different sample periods. b. Susan's manager directs her to use the return statistics calculated using data for the period Jan 2010-Dec 2019 from now on. Her next task is to compute the global minimum variance portfolio allowing for short-sales. The minimization problem is minm..mama on s.t. my + m2 + m3 = 1 Are there any negative weights in this portfolio? If so, interpret them. Compute and report the expected return, and standard deviation of this portfolio. day date month 1990 1990 1990 1990 1990 40% 1900 1990 1990 1990 1990 40% 1980 1991 1991 1991 99 1991 1991 1991 1991 1991 1992 1992 1992 1992 OOO 88 NDENDE & BOON 1992 GEBM AAPL 1/31/90 35% 48 2/28/90 -0.0% 66% 0. 3/30/90 229 18.4% 4/30/90 -0.4% 21 -22 5/31/90 1125 5.0% 6/29/90 0.5% -215 8.5% 7/31/90 A 8/31/90 13.4% 75% 11.8% 92890 - 113 21.6% 10/31/90 11/30/90 53% 904 199X 1231190 17.0% 1/31191 11.5% 228191 70% 2.5% 32891 245 11% 18.8% 16% 19.15 5/31/91 6/28/91 42% - 11.7% 7/31/91 -10% 11.4% 8/30/91 22% 9/30/91 70% 1031191 -0.5% 524 11/29/91 6.2% 46% 12/31/91 19 ON -3.8% 11.15 1/31/92 -16% 1.15 149 2/28/92 45% 2.15 44% 3/31/92 -30% - 13.7% 4/30/92 12% 3.2% 5/29/92 -0.3% 13 6/30/92 25% 7945 - 19.5% 7/31/92 -16% -32% -26% 8/31/92 33% -739 -1.3% 9/30/92 10/30/92 - 172 16.3% 11/30/92 12/31/92 3.5% 3.9% 1/29/93 7% 225/93 -23% 3/3193 4/30/93 17% 5/28193 23% 6/30/93 7/30193 2.9% 831/93 0.3% 930793 102993 11/30793 177% 28% 12131/93 7.3% 1/31/94 27% 12.0 2/28/94 -22% 60% 11.8% 3/31/93 445 335 4/29/94 48% 53% 5/31/93 4.5% 100% 2.15 6/30/94 -5.6% 67% 94% 7/29/94 8.0% 5.3% 27.1% 8/31/94 -1.2% 11.1% 7.8% 9/30/94 2.5% 16% 1992 1992 1992 65% 1992 88889988 1992 1992 1990 1993 1990 1995 1993 1993 1993 1993 1993 1993 1993 1993 1994 1994 1994 1994 1994 1904 0992891 KAKAK 9 12% 149 1994 1994 1994 58 1994 1994 80% -1.2 -25% 53% 11.15 27.1% 7.8% -6.9% 1994 1994 o 16% 70% 4.7% 1994 1994 1995 1995 7/29794 8/31/94 9/30/94 10/31/94 11/30/94 12/30/94 1/31/95 2/28/95 3/31/96 4/28/96 5/31/96 6/30/95 713195 8/31/96 5.9% 11.8% 10% 6.3% 06 -1995 -13.5% 47 3.5% -1.9% -10.8% 8.5% 1995 1995 GO ON 91% 15.25 -15% 1995 3.6% 1995 1995 47 134 1995 1996 1996 1996 88988989489 -0.89 29 6.15 5.3% 1995 79% 1996 18.7% -13.3% 1996 NONNE & 38% 1996 1996 934 -10.7% -0.8% 96 -19 7.15 4.8% 4.79 115 100% 6.3% 75% 06% -7 86% 6.7% 1996 1996 894 1996 1996 10.2 8.5% 3.7% 4.9% -13.5% -20.4% 1996 1996 4.7% 1997 1997 3.6% 23.8% 499 3.5% 8.15 4.5% 16.99 809 4.3% 172 1997 1997 -30% 1.8% 8.8% 77% 1997 1997 1997 1997 -10.8% 10/31/05 11/30195 12129795 1/31/96 229/96 3/2006 4/30/96 531796 6/28/96 7/31/96 8/30796 9/30/96 10/31/96 11/29/96 12/31/96 1/31/97 2/28/97 3/31/97 4/30/97 5/30/97 6/30/97 73197 8/29/97 9/30/97 10/31/97 1128797 123197 130/98 227198 33198 4/30/98 5129198 6/30/98 7/31/98 8/31/08 9/30/98 10/30/98 11.30198 12/31/98 129/99 2/26/99 3/31/99 4/30/99 5/28/99 6/30/99 7/30/99 ON 1997 1997 1997 64666466666666666 11.49 45% NOUNDB8SOON -5.1% 14.3% -0.3% 5.6% 0.3% 1124 1997 1998 1990 1998 1990 22 OS 888 1998 1998 1998 1908 15.45 -1489 1415 456% 2223 113 21% 90% 13% -10.6% -0.2% 10.09 3.3% 133% 28% 44% 10.6% 4.7% -3.5% 11.15 -3.2% 1998 1998 1998 1999 1999 1999 11.7% 0.5% 7245 44% 18.0% 11.09 15.5% 3.2% 28.0% 1909 1999 5.1% 2023 1999 11.4% 1999 1999 88 -20% -0.8% 5.1% 2023 17.2% 1999 1999 26.6% 1999 1999 1999 2000 88% 5.0% 47% 41 8.45 5.0 2000 11.1% 32 30% 5.9% 14.3% 40% 19.2% -13.7% -0.9% 1795 1.0% 0.55 0.6% -27% 14.15 -15% 50% 10.5% 18.5% 2000 2000 2000 6/30/99 7830/99 8/31/99 930/99 10/29/99 11/30/99 12/31/99 131100 22900 3/31/00 4/28/00 5/31/00 6/30/00 713100 8/31/00 9129/00 10/31/00 11/30/00 12129/00 1/31/01 22801 3/30/01 4/30/01 5/31/01 6/29/01 5.5% 36% 20% 2000 O NON SOGN 2000 2000 2000 2000 2001 24.75 19.9% -57.7% 24.0% -15,75 5 & 5 && - 1245 49% 0.1% 31.8% -107 2001 2001 -30% 41 1.15 -9.6% 15.9% 10% -0.5% 2001 2001 19.7% 24 1.1% 69% - 15.6% 20.9% 15.5% 21.79 16.5% 2001 2001 2001 8245 17 8% 2001 2001 2001 2001 2002 2002 -5.8% 8.8% -21% 5.7% 46% -73% 16.4% 13.2% 21.3% 28% 12.9% -12,2% 2002 2002 2002 2002 YON -10.8% 8.9% 60% -195 -3.8% -10.5% -27% -15 85 -13% 6.15 10.8% 25% 4.0% 2002 73% 2002 2002 22 2002 2002 2002 2003 2008 2003 3.5% -7.5% 8/31/01 9/2001 10/31/01 11/30/01 12/31/01 1/31/02 2/28/02 3/28/02 4/30/02 5/31/02 6/28102 7/3102 8/30/02 9/30/02 10/31/02 11/29 02 1213102 101/03 2128/03 3/31/03 4/30/03 5/30/03 630/03 7/31/03 8/29/03 9/30/03 1031/03 11/28103 12/31/03 1/30/04 2/27/04 3/31/04 4/30/04 5/28104 6/30/04 17.6% 24% 745 95% -5.0% 4.8% 10.8% 09 0.1% 00% 3.8% 2003 15.5% 2003 2003 2003 2003 2008 2003 380VUN 106 77 1.35 2003 2003 06% -0.89 4.0% 1.5% 27% -1.2% 8.8% 8.6% -27% 24 -1.9% 3.9% 48% 2004 8.7% 223 5.6% 6095 130% 4.7% 7.15 -26% 4.8% 4.0% 07 0.5% 2004 2004 2004 2004 2004 16.0% 2004 2004 88 -1.9% 3.9% 4.8% 40% 0.7% 0.5% - 1256 2004 16.0% 0.6% 2004 26% 2004 2004 2004 4/30/04 5/2004 6/30/04 730/04 8/31/04 9/30/04 10/29/04 11/30/04 1231104 1/31/05 22805 -1.4% 3.0% 888 16% 12% 47 5.2% 45% 124% 3523 28.0% 2004 2004 36% 3.8% -10% 2005 2005 2005 07 19.4% 16.7% 24% -13.5% 10:35 0.8% 44% 04 -15% 12.5% 15.9% 2005 2005 2005 2005 2005 2005 2005 2005 2005 N&D NON- 88988 8988989 0.5% 2.15 0.7% 5.3% 17.8% 1246 66% 75% -1.15 2006 5.0% LIS 28% 2006 2006 2006 2006 5.8% -0.5% -10% 1223 2006 423 18.7% 2006 0.85 50% 2006 2006 2006 2006 2006 OOOON OWN-NO 42% 44% -0.5% 05% 6.35 -3.1% 12% 1279 0.15 5.7% 2.15 609 13.5% 5.3% 13.0% 2007 2007 -1.3% 2007 13% 2007 429105 5/31/05 6/30/05 7129/05 8/31/05 30/05 10/31/05 11/30/05 12/30/05 131/06 2128/06 3/31/06 4/28/06 531/06 6/30/06 7/31/06 8/31/06 9/29/06 10/31/06 11/30/06 12/29/06 1/31/07 22807 3/30/ 07 4/30/07 5/31/07 6/29/07 7/31/107 8/31/07 9/28107 10/31/07 11/30/07 1231/07 1/31/08 2129/08 3131/08 4/30/08 5/30/08 630/08 7/31/08 8/29/08 930/08 10/31/08 11/28/08 12/31/08 1/30/09 2/27/09 3/31/09 4/30/09 20% 8.49 47 -13% 21.45 0.75 2007 2007 2007 2007 2007 2007 26% 13% 0.3% 72% 5 10.8% 23.8% 4.15 2007 -7.0% 2007 2008 0.9% 2008 -5.45 2008 N NON- 588 - 116% 2008 2008 4. 21.25 76% 2008 84 - 11.3% 5.15 2008 2008 2008 2008 33.0% -12-15 6.09 -0.7% 8.15 23.5% -120% -3.8% -25.15 -273% 18 25.1% 45% 39 -20.5% - 11.75 3.1% 2008 2008 2009 -13.9% 799 5.6% 0.9% 177 2009 10% 2009 2009 53% 6.5% 19.7% & 2009 2009 273% 18.8% 25.15 1.045 53 & 2009 2009 65% 35% & 2009 2009 2009 NEW UN- -123% 14.3% -0.9% 17.7% 19.7% 7.9% 49% 14 2.9% 102 17% 6.15 5.4% 1294 05% 13 3.7% 188 2009 2009 2009 2009 2010 1234 4.9% 6.35 OS 133 52 3.6% 65% 43% 09 06% 2010 9%88898988 2010 14.85 2010 2010 215 2010 2010 va -13.3% - 11.2% 11.8% -102 13.15 40% 2010 23% 5.5% 16.7% 2010 2010 1 2010 2010 16.45 10.15 37 2011 2011 2011 2011 2011 ON 0.5% 0.7% -3.5% 16.3 8.94 71% -10% 37 10.45 0.3% 07 46% 0.5% 1.6% 6.0% -5.15 1.75 5.6 2011 2/27/09 3/31/09 4/30/09 5299 630/09 7/31/09 8/31/09 9/30/09 10/30/09 11/30/09 12/31/09 129/10 2/26/10 3/31/10 430 5128/10 6/30/10 7/30/10 831/10 9/30/10 10/29/10 11/30/10 12/31/10 1/31/11 2/28/11 3/31/11 4/29/11 5/31/11 6/30/11 7/29/11 8/31/11 9/30/11 10/31/11 11/30/11 12/30/11 1/31/12 2/29/12 3/30/12 4/30/12 5/31/12 6/29/12 731/12 83112 9/28/12 10/31/12 11/30/12 12/31/12 131/13 2128/13 3/28/13 4/30/13 5/31/13 6/28/13 7/31/13 8/30/13 9/30/13 10/31/13 11/29/13 12131/13 1/31/14 2011 42% 20% -4.0% -32% -50% -8.9% -5.8% 98% 4.8% 13.6% 455 275 2011 0.9% 2011 2011 2011 2011 -5.6% 6.0% 2012 5.45 61% 2012 2012 2012 2012 2012 2012 66 898 14 1.1% 2012 2012 65% 2012 10 2012 & SOUND ON -25% 10.15 0.4% -02 10.5% -73% 0.3% 0.2% 6.15 5.15 -0.4 -3.6% 5855 2013 6.09 144 25% 2013 2013 2013 62 5.0% 3.25 0.0% 2013 2013 2013 0.3% 5.1% -50% 4.1% 215 6.15 16% 8.3% 2013 2013 2013 2013 2013 0.89 20% 6.0% -10.3% 95% 70% 0.9% 10.8% 2014 -5.8% Una 2013 4.4% 60% 10 2014 10.8% 2014 5858 229 ST 2014 20% GOWN - 1.6% 39% 2014 2014 78% 2014 -1.1% 20% 536 404 2.15 55% . 57 9 -13 30% 07 43% 2.9% 2014 2014 2014 2014 -0.5 0.7% 265 2014 10.6% 2014 2015 NNE 44 63% 2015 888498989898988 98% 100% 3.15 2015 2015 2015 2015 2015 02 4.19 9.15 0.75 -1.75 -18% 4.9% 25% 3.3% 2015 2015 2015 2015 2015 0.5% -1 93% 2016 2016 60% 11 -7.5% 0.1% 12.7% -14.0% 2016 2016 15 EN -3.6% 6.3% 2016 12/31/13 1/31/14 2/28/14 3/31/14 4/30/14 5/30/14 6/30/14 7/31/14 8/20/14 9/30/14 10/3114 1128/14 12/31/14 1/30/15 227115 33415 4/30/15 5.2015 6/30/15 731/15 8/31/15 9/30/15 1030 11/30/15 12131/15 129/16 2/29/16 3/31/16 4/29/16 5/31/16 6130/16 7/29/16 8/31/16 93016 10/31/16 11/30/16 12/30/16 1/31/17 228/17 3/31/17 428/17 531/17 6/30/17 7/31/17 8/31/17 9/29/17 103/17 11/30/17 12/29/17 1/31/18 2/28/18 3/29/18 4/30/18 $3118 6/29/18 7/01/18 31/18 9/28/18 10/31/18 11/30/18 2016 2016 9.0% 24% 2016 N8 NOVO OOON 3.5% 48% 66% 0.9% 9.1% -33% -1.7% 49% - 1.1% 0.3% 4.4% -1895 5.7% 3.5% -6.0% 12% -0.04 -27% -5.65 0.5% -5.2% 58 -0.25 0% 325 2016 2016 2016 2016 2017 2017 2017 2017 2017 0.4% 23% 5.15 2017 6.0% 2017 2017 2017 65595 10 2017 05 - 16.6% -93% -3.9% 2017 2017 2018 2018 6.8% 2018 85X855 2018 -1.15 2018 2018 2018 2018 - 120% 4.5% 44% 0.15 -25% 0.1% -5.1% -11.8% -10.5% - 2575 -1.5% 13.5% -0,9% 2.8% 20.0% 2018 2018 88 2.2% 325 -23.7% 2018 - 18.1% 2015 2015 2015 2015 0.9% 6.79 024 4.15 0.4% 0.6% 45% 07 17% 2015 2015 3. 6.6% 30 2015 2015 2015 2015 0.5% - 13% 93% 2010 2016 2016 0.6% - 11.0% -7.5% 0.1% 127% & 15.6% & 2016 2016 2016 && 2016 -1 50 025 2016 24% 6.6% 2016 % 2016 -22 2016 2016 2017 4889 6.5% 23% 5.15 13.45 2017 2017 2017 2017 00 2017 Nova 00 ONS WOON OOONOBYONO 2017 2017 2017 2017 3/31/15 4.5% 4/30/15 9.1% 5/29/15 6/30/15 7/31/15 -1.8% 8/31/15 9/30/15 25% 10/30/45 147% 11/30/15 3.5% 12/31/15 48% 1/29/16 86% 2/29/16 3/31/16 4/29/16 5/31/16 -17% 30/16 494 7/29/16 -1.15 8/ 31/16 0.3% 9305 445 1031/16 -18 11/30/16 5.7% 12/30/16 35% 1017 60% 2/28/17 12% 3/31/17 4/28/17 -27% 5/31/17 -5.6% 6/30/17 -0.5% 7/31/17 -5.2% 8/31/17 4.1% 9/29/17 -0.5% 10/31/17 -166% 1130/17 -9.35 12/29/17 3.9% 1/31/18 -73% 2/28/18 -120% 329 45% 40 44% 53/ 0.1% 6918 -255 73 3 -5.15 925 18 11.8% S 105 ILIOS 123/ 1.1% 34245 2219 62% 329 4/30/19 18% 531719 -725 62519 11.3% 7/31/19 -0.5% 8/30/19 21.1% 930/198 .5% 10/119 118 11/29/19 12.9% 12/31/19 -0.9% 32% A 3 0.8% -6.0% 015 145 5.7% 3.3% 10 60% 9.7% 20% -1.5% 2017 0.99 2017 2018 2018 2018 2018 2018 6.7% 3.9% -15% 55 5.85 -1.5% 13.5 0.9% 2018 20.0% 2018 2018 2018 2018 -30% 181% 2018 2018 2019 13119 2019 2019 2019 225 0.6% 8.3% 2019 -124 1315 75% -1.7 2019 2019 2019 2019 2019 2019 2019 75% 75% 73% 80% 17 0.3% 31 99%