

Answered step by step
Verified Expert Solution
Question
1 Approved Answer
pls help me with both the questions and pls use proper indention and pls send the screenshot of the code as well this was the
pls help me with both the questions and pls use proper indention and pls send the screenshot of the code as well 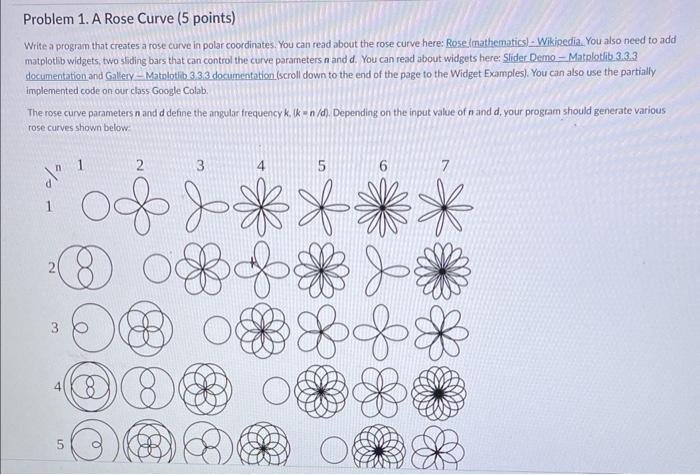
 this was the hyper link in the first question pls help me with the question and the second part as well thank you
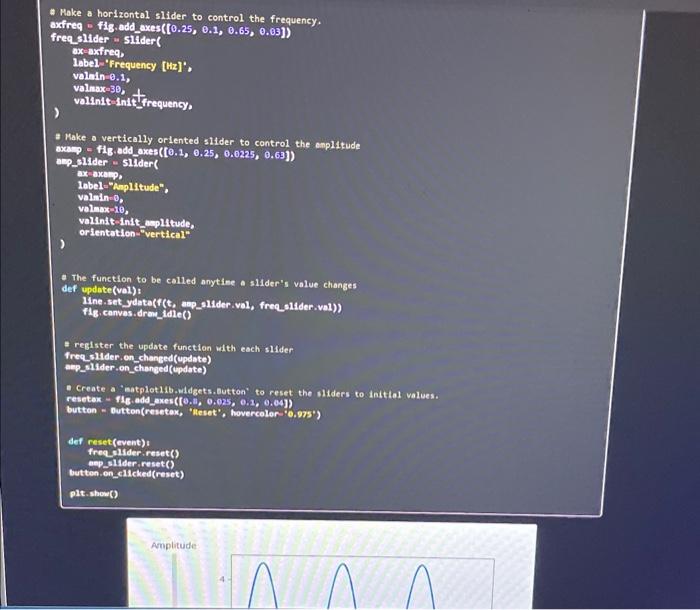
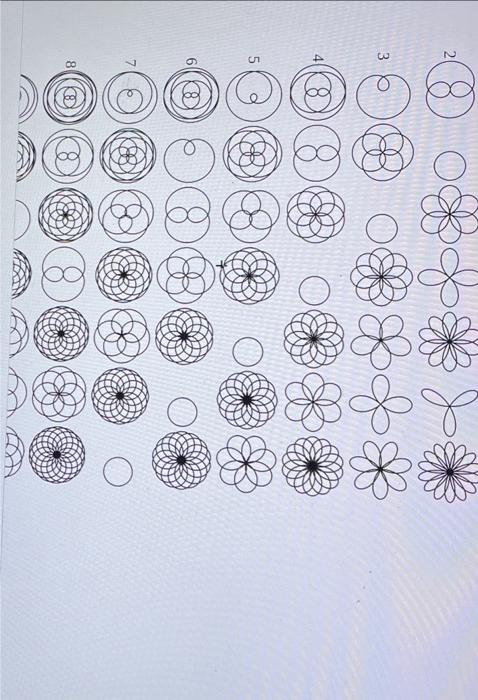
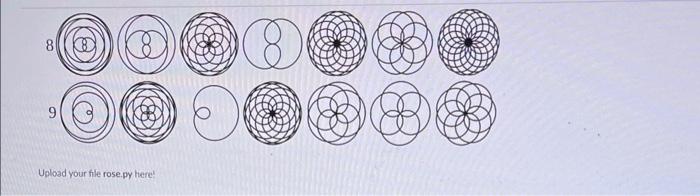
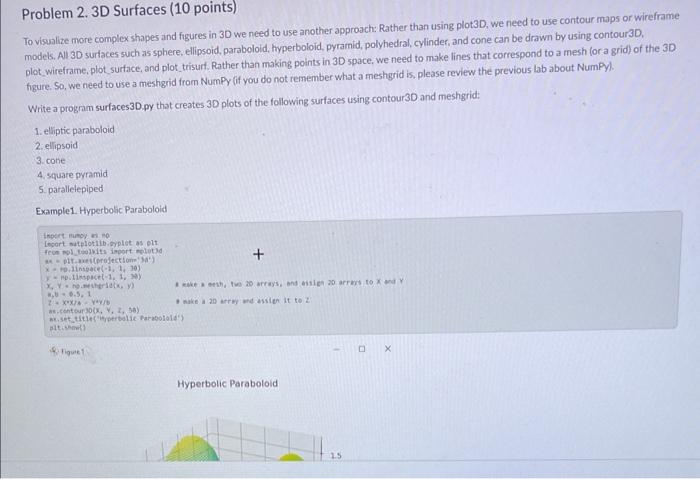
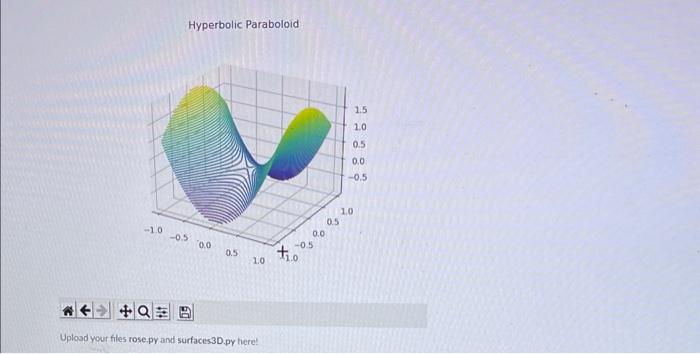
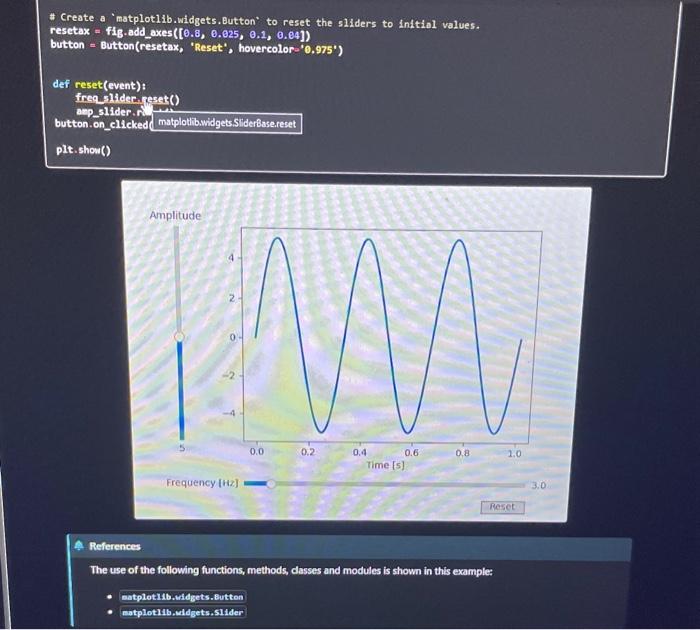 Write a program that creates a rose curve in polar coordinates. You can read about the rose curve here: Rose:mathematics) - Wikinedia. You also need to add matplotib widgets, two stading bars that can control the curve parameters n and d. You can read about widgets here: Slider Demo - Matplotfib.3.3.3. documentation and Gal eery - Matolotib 3.3.3 docuumentation (scroll down to the end of the page to the Widget Examples). You can also use the partially implemented code on our class Google Colab. The rose curve parameters n and d define the angular frequency k, (k=n/d. Depending on the input value of n and d, your program should generate various rose curves shown below: (@)(3) 0 () 0 ( ) () () () (3) (2) (8) (8) (2) Upload your file rose.py here! Problem 2. 3D Surtaces (1U poifits) To visualize more complex shapes and figures in 3D we need to use another approsch: Rather than using plotin, we cylinder, and cone can be drawn by using contour3D, models. All 3D suriaces such as sphere, ellipsoid, paraboloid, ityperboloid, pyramid, polyhedrab cylinder and cone can be drawn by use, we need to make lines that correspond to a mesh for a grid) of the 3D plot wireframe, plot surface, and plot trisurt. Rather than making points in 30 space, we need the please review the previous lab about NumPy.. figure. So, we need to use a meshgrid from NumPy (if you do not ien 3 plots of the following surfaces using contour 3D and meshgrid: Write a program surfaces 3D.py that creates 30 plots of the foilowing surfaces using contour 30 and meshgrid: 1. elliptic paraboloid 2. ellipsoid 3. cone 4, square pyramid 5. paralleiepiped Example1. Hyperbolic Paraboloid Inpert manoy an 80 . Lesart natplotilibipist as olt fecon mol freakits inport patutid. at = ptr me isprogectionn' Mat\} - pritisede (=1,1,10) mo. mirspect (1,1,14) ,bb=6.5e1 Zi+x*xis yayib o make a 20 arrey and asilen it to 2 ws.fenteur 30(x,y,2,58) Bx. setatiflef ioyperbalic Rarabololity alt ithing 19. Higute 1. Hyperbolic Raraboloid Hyperbolic Paraboloid Upload your files rose.py and surfaces 3D.py here! Slider In this example, sliders are used to control the frequency and amplitude of a sine wave. See Snapping Sliders to Discrete Values for an example of having the slider snap to discrete values. See Thresholding an Image with RangeSlider for an example of using a Rangesifder to define a range of values. import nunpy as np inport eatplotilb.pyplot as plt fron estplotilbuidgets inport stider, Button \# The paranetrized function to be plotted def f(t, anplitude, frequency): return eplitude npsin(2npp1 * frequency * t) t=np.11nspece(,1,10e0) \[ \begin{array}{l} \text { E Define initial parameters } \\ \text { Inlt_aplitude }=5 \\ \text { init_frequency }=3 \end{array} \] - Create the figure and the 1 ine that we w111 manipulate fis, ax = plt, subplots() \[ \begin{array}{l} \text { line, }=a x . p l o t(t, f(t, \text { inlt_-plitude, intt_frequency), 1w-2) } \\ \text { ax.set_xlabel('Tine }[s]^{\prime} \text {.) } \end{array} \] In adjust the main plot to make room for the sliders fig-subplots_edjust (left-0.25, botten- 0.25) - Make a horizontal slider to control the frequency. axfreq - fig.add_axes([0.25, 0.1,0.65,0.03]) freq sulder = stifder( ax axfireq, valmin- .1, valnax-3e, valnax-30, ) velinit-init_frequency, \# Make a vertically oriented slider to control the asplitude axapp = fig, add_axes ([0.1,0.25,0.0225,0.63]) anp stider - stider 1abel-"Aapiftude", vatnin , valnax-10, volinit-inlt_eplitude, H Make a horizontal slider to control the frequency. axfireq = fig. add axes ([0.25,0.1,0.65,0.03]) freq slter w stider( axiberireq. 1abel- 'Frequency [Hz] ', vainin 0.1, valmax 30, , * Make a vertically orlented slider to control the enplizude axa = f1. add axes ([0.1,0.25,0.0225,0.63]) anp stider = sluder( axaxapp Iobel="Arplitude". valn in 0 velame 10, valintt-intt anplitude. orientation "vertical" - The function to be called anytine a silder's value changes def update (val): Hine.set ydata(f (t, asp slider.val, freq sldder.val)) T1g. canves.drewadie() I register the update function with each slider Treq sluder. on_changed(update) aep_slider,on_changed(cpdate) - Create a "eatplot11b.-idgets, But.ton' to reset the sliders to int resetax = f1B,add_axes ([0,11,0.025,0.1,0.04]) butten = Dutton (resetox, 'iteset', hovercolors:'0.97s') def reset(event): Treq_slider, reset() bep_slider, reset() button.en_clicked(reset) plt. show() Amplitude References The use of the following functions, methods, dasses and modules is shown in this example: matplotllb, mdgets.5lider
pls help me with the question and the second part as well
thank you
Step by Step Solution
There are 3 Steps involved in it
Step: 1

Get Instant Access to Expert-Tailored Solutions
See step-by-step solutions with expert insights and AI powered tools for academic success
Step: 2

Step: 3
Ace Your Homework with AI
Get the answers you need in no time with our AI-driven, step-by-step assistance
Get Started
Understanding Oracle APEX 5 Application Development
Authors: Edward Sciore
2nd Edition
1484209893, 9781484209899