pls
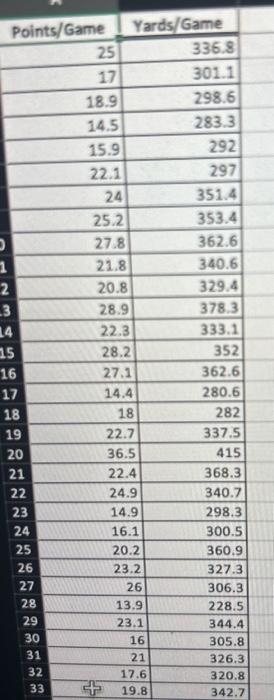
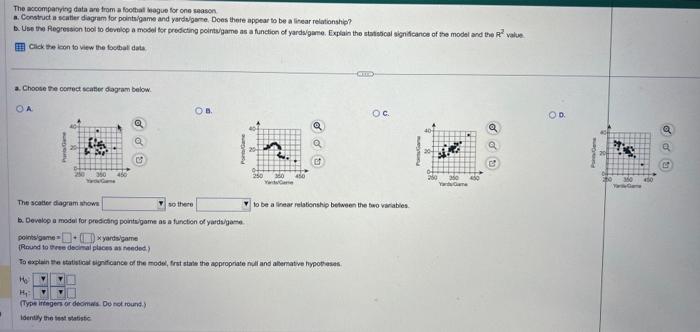
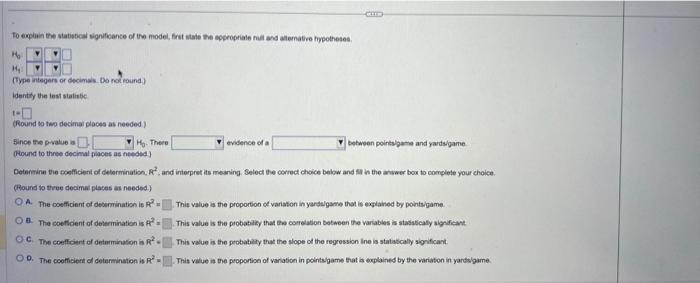
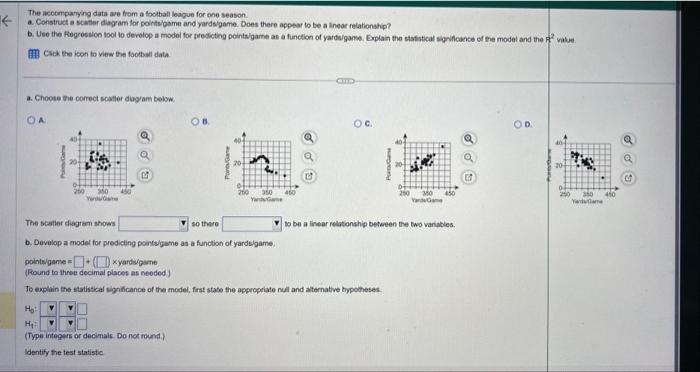
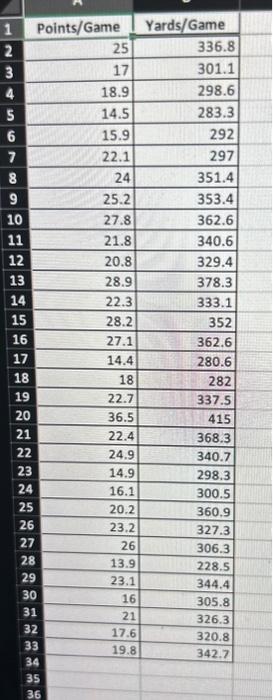
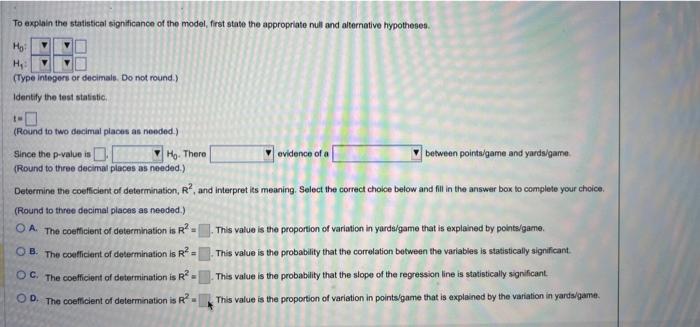
The accomparying data ave from a foothal mague for one season. a. Construct i tcather diagram for pointsigame and yardugome, Does there appear to be a lisear relationshio? B. USe the Regreltion tool to develop a mosil for predcting pointygame as a function of yardsigame. Explain the statsoical aignicance of the model and the R. value. Cick the ken to view the factali data a. Choose the cerrect seaber dagram bebow. 8. The scakee dlagram whown wo there to be a linear relationshio between the fwo viriaties. b. Devalop a model for predicing pointsgame as a functen of yardsiga-en. poinhslgame = ( x yartshame PRrund to Free dbcinal phces as reeded. ) To explain the ctatiotoar significance of the modes, frst stabe the appropriate null and abernatye hypopesas. the H1= (Type integen or deomats De not round.) To empinia the statistical signifcance of the model, fret stale the approgriale hul ard allemative fypotheses. (Fiyte antegers of decimas. Do rok found) Identidy the iest statistic (Round to tep decimat places as needed ) Fince the p-value a (Hound to three decimal faces as nesold) Detnimine the confficient of detormination. A2, and interpret its mearing. Select the correct choice below and fil in the aviwer bou to complete your choice. (Pound to three decimal places as needod.) A. The coeffient of debermination is R2= This value a the proportion of variaton in yaratgame that is exglained by pointhigame. C. The coefficient of detmmination is R2 = This value is the probathey that the slope of the regression ine is statascally significant. 0. The coofficient of determinston is R2=. This vilue ia the proportion of variation in pointsigame that is axplained by the variafion in yardslgame. a. Choose the correct soatlor diagyam belyw. The bcetler diegram thoes b. Develop a model for prediating pointsygame pointsigame r x yardispaine Pround to three decimal places as neoded) To explin the statisdical significance of the mo To explain the statistical significance of the model, first state the approprlate null and alternotive hypotheses. (Type int0rs or decimale. Do not round.) Identify the test statistic 1= (Round to two decimal places as nooded.) Since the p-value is H0. There evidence of a (Round to three decimal places as needed.) Determine the coefficient of determination, R2, and interpret its meaning. Select the correct choice below and fill in the answer box to complete your choice. (Round to three decimal places as needed.) A. The coeflicient of determination is R2=. This value is the proportion of variaticn in yardsigame that is explained by polntsigame. B. The coefficient of determination is R2=. This value is the probability that the correlation between the variables is statistically significant. C. The coefficient of determination is R2= This value is the probability that the slope of the regression line is statistically significant. D. The coefficient of determination is R2. This value is the proportion of variation in pointshgame that is expleined by the variation in yardaigame. The accomparying data ave from a foothal mague for one season. a. Construct i tcather diagram for pointsigame and yardugome, Does there appear to be a lisear relationshio? B. USe the Regreltion tool to develop a mosil for predcting pointygame as a function of yardsigame. Explain the statsoical aignicance of the model and the R. value. Cick the ken to view the factali data a. Choose the cerrect seaber dagram bebow. 8. The scakee dlagram whown wo there to be a linear relationshio between the fwo viriaties. b. Devalop a model for predicing pointsgame as a functen of yardsiga-en. poinhslgame = ( x yartshame PRrund to Free dbcinal phces as reeded. ) To explain the ctatiotoar significance of the modes, frst stabe the appropriate null and abernatye hypopesas. the H1= (Type integen or deomats De not round.) To empinia the statistical signifcance of the model, fret stale the approgriale hul ard allemative fypotheses. (Fiyte antegers of decimas. Do rok found) Identidy the iest statistic (Round to tep decimat places as needed ) Fince the p-value a (Hound to three decimal faces as nesold) Detnimine the confficient of detormination. A2, and interpret its mearing. Select the correct choice below and fil in the aviwer bou to complete your choice. (Pound to three decimal places as needod.) A. The coeffient of debermination is R2= This value a the proportion of variaton in yaratgame that is exglained by pointhigame. C. The coefficient of detmmination is R2 = This value is the probathey that the slope of the regression ine is statascally significant. 0. The coofficient of determinston is R2=. This vilue ia the proportion of variation in pointsigame that is axplained by the variafion in yardslgame. a. Choose the correct soatlor diagyam belyw. The bcetler diegram thoes b. Develop a model for prediating pointsygame pointsigame r x yardispaine Pround to three decimal places as neoded) To explin the statisdical significance of the mo To explain the statistical significance of the model, first state the approprlate null and alternotive hypotheses. (Type int0rs or decimale. Do not round.) Identify the test statistic 1= (Round to two decimal places as nooded.) Since the p-value is H0. There evidence of a (Round to three decimal places as needed.) Determine the coefficient of determination, R2, and interpret its meaning. Select the correct choice below and fill in the answer box to complete your choice. (Round to three decimal places as needed.) A. The coeflicient of determination is R2=. This value is the proportion of variaticn in yardsigame that is explained by polntsigame. B. The coefficient of determination is R2=. This value is the probability that the correlation between the variables is statistically significant. C. The coefficient of determination is R2= This value is the probability that the slope of the regression line is statistically significant. D. The coefficient of determination is R2. This value is the proportion of variation in pointshgame that is expleined by the variation in yardaigame


